A yield curve is a graph that plots the interest rates, or yields, of bonds with the same credit quality but different maturity dates. In Canada, the most commonly referenced curve is based on Government of Canada bonds, ranging from short-term treasury bills to long-term bonds. The curve's shape is a crucial indicator for investors and policymakers, as it reflects market expectations for economic growth, inflation, and future interest rates. Understanding the yield curve is essential for Canadians as it influences everything from mortgage rates to the overall health of the economy.
What Is a Yield Curve?
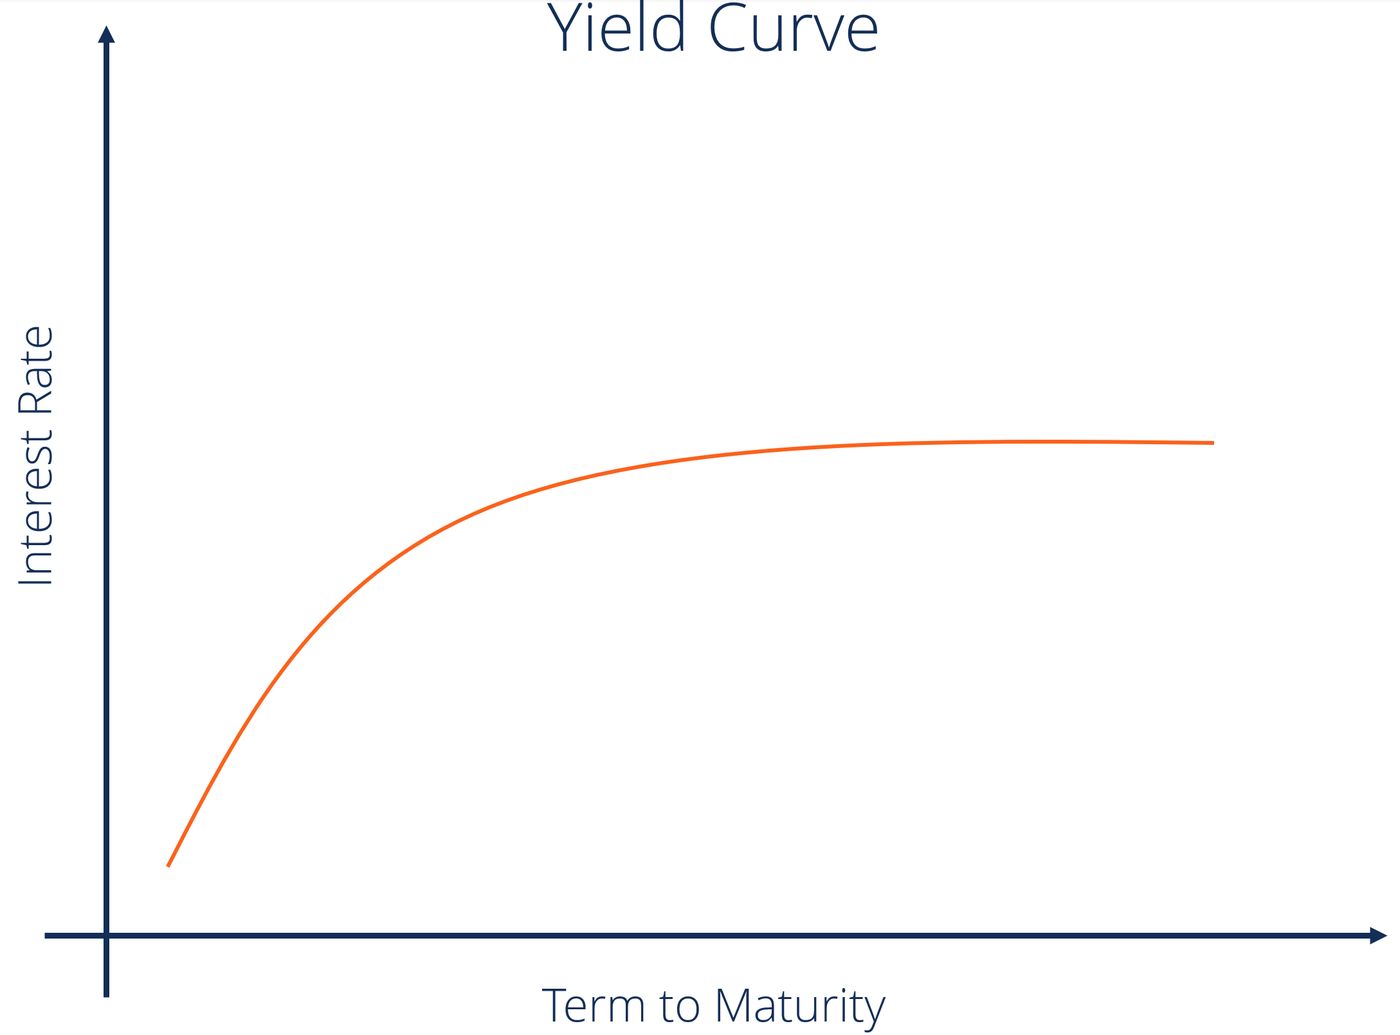
A yield curve visually represents the relationship between the yield, or interest rate, and the time to maturity for a set of comparable debt securities. The most fundamental yield curve is built from bonds issued by a single borrower, such as the Government of Canada, ensuring credit quality is constant across all plotted points. The curve typically has maturities, ranging from three months to thirty years, on the horizontal axis and the corresponding yields on the vertical axis. Different markets publish related curves for various purposes, including government bond curves, overnight indexed swap curves, and interest rate swap curves. These families of curves are produced by central banks and data providers from the trading prices of instruments in each specific market. Analysts often summarize the entire curve's shape with a single metric called a term spread, such as the difference between the 10-year bond yield and the 3-month Treasury bill rate.
The yield curve is closely related to the broader concept of the term structure of interest rates. Official sources distinguish several ways to summarize this structure, including zero-coupon or spot curves, implied forward curves, and par yield curves, each derived from the same underlying market prices. The construction of a swap curve, which reflects interbank funding costs and derivatives pricing, is distinct from the government curve and typically sits above it for the same currency. Corporate yield curves, based on bonds issued by companies, are often quoted as a credit spread over the relevant swap curve, reflecting the higher risk. In essence, there is no single yield curve describing the cost of money for everybody, as it varies by currency, issuer creditworthiness, and market segment.
Interpreting the Shape of the Curve
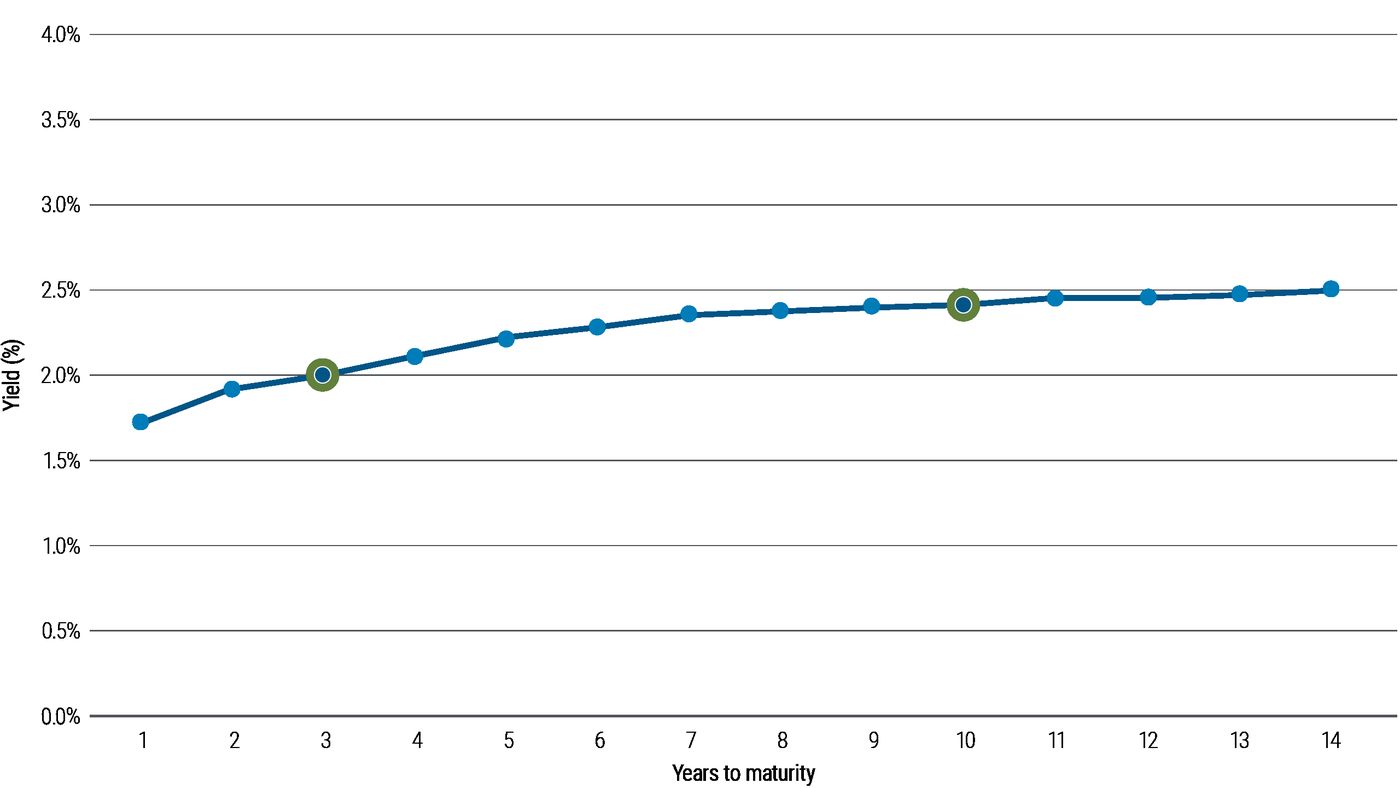
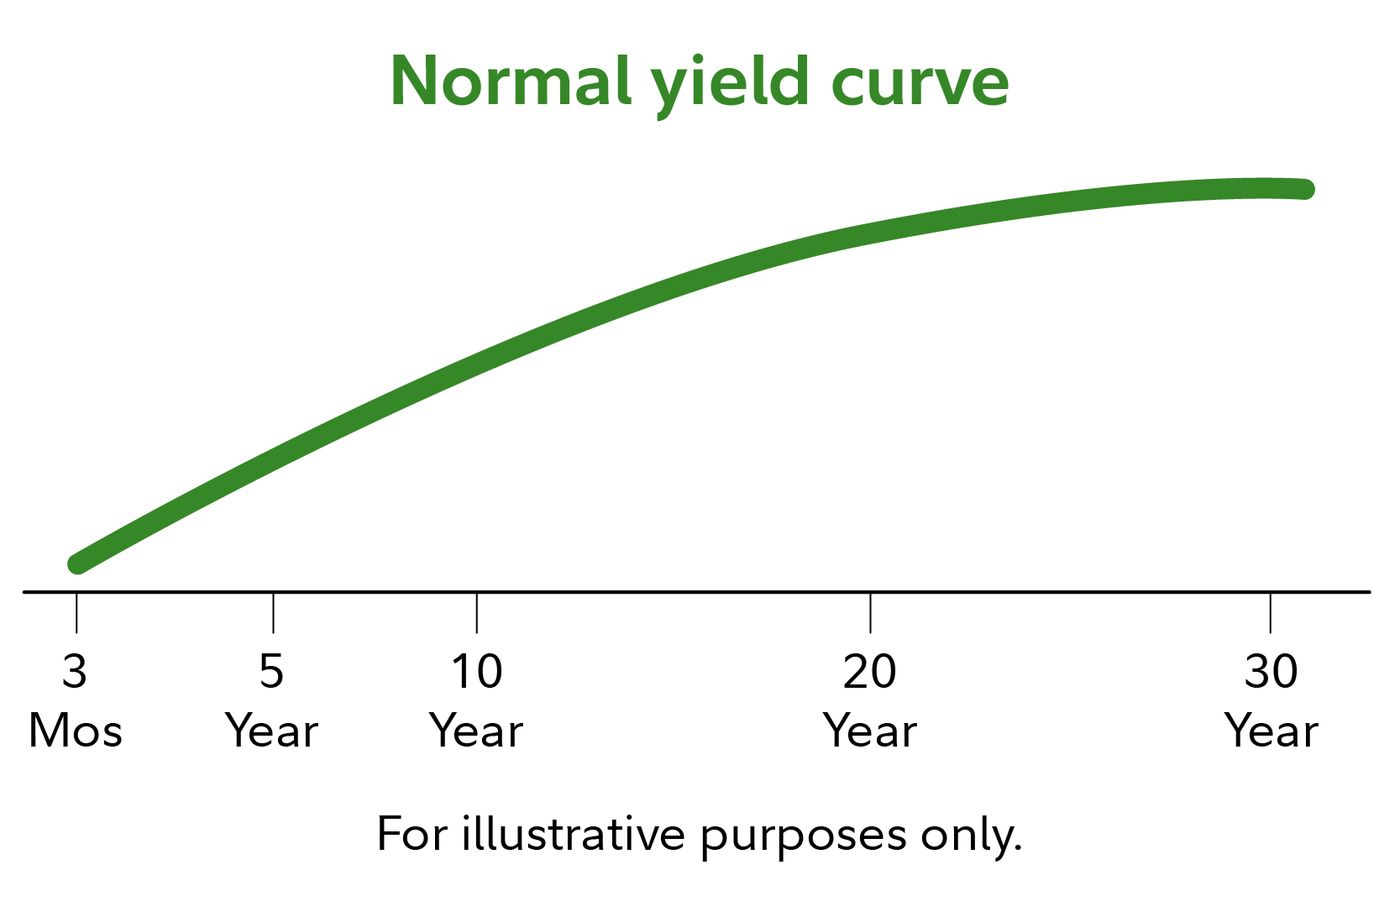
The slope and shape of the yield curve convey powerful signals about market expectations and economic risks. A normal, upward-sloping curve, where long-term yields are higher than short-term yields, has been the predominant shape from the post-Great Depression era to the present. This positive slope is consistent with expectations of higher future short-term rates and includes term premia that compensate investors for the uncertainty and risk associated with longer time horizons. Since 1990, a normal yield curve for Government of Canada bonds has typically shown yields on 10-year bonds about 1.4 percentage points, or 140 basis points, higher than the yield on 3-month Treasury bills.
An inverted yield curve, where short-term interest rates exceed long-term rates, is an unusual but significant shape. It occurs when investors anticipate falling interest rates and a potential economic recession, leading them to accept lower long-term yields to lock in rates before they decline further. Every recession in the United States since 1970 has been preceded by an inverted yield curve, specifically when the 10-year Treasury yield fell below the 3-month Treasury bill rate. A steep yield curve, where the spread between long and short rates expands notably beyond the normal range, is generally observed at the beginning of an economic expansion. At this point, short-term rates are low due to prior economic stagnation, but demand for capital increases, leading to higher long-term yields as investors fear future inflation.
A flat yield curve is observed when all maturities have similar yields. A humped curve results when short term and long term yields are equal and medium term yields are higher than those of the short term and long term. A flat curve sends signals of uncertainty in the economy. This mixed signal can revert to a normal curve or could later result into an inverted curve. The shape of the yield curve is influenced by supply and demand. For instance, if there is a large demand for long bonds from pension funds to match their fixed liabilities, and not enough bonds to meet this demand, then the yields on long bonds can be expected to be low, irrespective of market participants' views about future events.
The Yield Curve and the Business Cycle
The slope of the yield curve is one of the most powerful predictors of future economic growth, inflation, and recessions. Measures of the slope are incorporated into key economic indicators, such as the Financial Stress Index published by the St. Louis Fed and the Index of Leading Economic Indicators from The Conference Board. Research by economists like Arturo Estrella and Tobias Adrian has established the predictive power of an inverted yield curve to signal a recession. Their models show that when the difference between short-term rates, such as 3-month Treasury bills, and long-term rates, like 10-year Treasury bonds, is negative or less than 93 basis points positive at the end of a central bank tightening cycle, a rise in unemployment usually follows.
The mechanism by which the curve affects the business cycle often involves the balance sheets of banks and financial institutions. When the yield curve is inverted, banks can find themselves paying more on short-term deposits than they earn on new long-term loans, leading to a loss of profitability, a reluctance to lend, and a resultant credit crunch. Conversely, an upward-sloping curve allows banks to profitably borrow short-term and lend long-term, encouraging credit supply and potentially leading to a credit bubble. The New York Fed publishes a monthly recession probability prediction derived from the yield curve based on this research. The yield curve became inverted in the first half of 2019 for the first time since 2007, preceding the economic downturn.
Key Theories Behind the Yield Curve
Economists have developed several theories to explain why yields vary with maturity, with three main perspectives attempting to describe the underlying forces. The pure expectations hypothesis is an extreme position that assumes bonds of different maturities are perfect substitutes. It posits that the shape of the yield curve depends solely on market participants' expectations of future interest rates, forcing long-term yields to equal the geometric mean of expected future short-term rates. This theory aligns with the observation that yields across maturities often move together, but it fails to explain the persistent upward slope of the curve and neglects the interest rate risk inherent in bond investing.
The liquidity premium theory is an offshoot of the pure expectations hypothesis that adds a crucial element. It asserts that long-term interest rates reflect not only expectations of future rates but also include a premium, known as the term premium or liquidity premium, for holding longer-term bonds. This premium compensates investors for the added risk of having their money tied up for a longer period, including greater price uncertainty and inflation risk. Because of this premium, long-term bond yields tend to be higher than short-term yields, resulting in the typical upward-sloping curve. The theory combines expectations with this risk premium in its formula.
The preferred habitat theory is a variant that adds further nuance. It states that investors have distinct investment horizons, or preferred habitats, and require a meaningful premium to buy bonds with maturities outside their preferred range. Proponents believe short-term investors dominate the market, which generally makes longer-term rates higher, but occasional conditions can make short-term rates exceed long-term rates. This theory helps explain why supply and demand factors for specific maturities, such as pension fund demand for long bonds, can influence the curve's shape independently of interest rate expectations.
The Canadian Yield Curve Context
In Canada, the primary yield curve referenced by investors, analysts, and media is the Government of Canada bond yield curve. It is constructed from the mid-market closing yields of selected Government of Canada bond issues that mature in approximately two, three, five, seven, ten, and thirty years. These selected benchmark bond yields are published by the Bank of Canada, with data sourced from CanDeal Data and Analytics. The specific bond issues used as benchmarks are updated when a new building benchmark bond is adopted by financial markets, typically following its last auction.
The Canadian yield curve serves as a crucial barometer for domestic economic sentiment and monetary policy expectations. A normal, upward-sloping curve suggests anticipated economic growth and stable inflation. As noted, since 1990, the typical spread between the 10-year bond and the 3-month Treasury bill has been around 140 basis points. When this spread widens significantly, creating a steep curve, it often signals the beginning of an economic expansion where demand for capital is rising. The Bank of Canada monitors the curve closely, as its shape influences decisions on the policy interest rate, which in turn affects borrowing costs throughout the economy.
Historical data for the Canadian yield curve is readily available, allowing for analysis of trends over the past decade. The curve continually moves during market hours, reflecting reactions to economic news and data releases. While the government curve is most cited, other important curves exist in the Canadian market, including swap curves that reflect interbank lending rates and provincial yield curves for bonds issued by provincial governments. Corporate yield curves also exist, quoted as a spread over the swap curve, reflecting the higher credit risk of corporate issuers compared to the federal government.
- The Bank of Canada publishes selected benchmark bond yields for key maturities.
- Primary data sources are CanDeal Data and Analytics and the Bank of Canada.
- Common benchmark maturities include 2-year, 3-year, 5-year, 7-year, 10-year, and 30-year bonds.
- The selected bond issues are updated when a new building benchmark bond is adopted.
- Other relevant curves include swap curves and provincial yield curves.
- Corporate yield curves are quoted as a credit spread over the swap curve.
Historical Context and Notable Shapes
The shape of the yield curve has not been constant throughout economic history. From the post-Great Depression era to the present, the yield curve has usually been normal, with a positive slope. However, during much of the 19th and early 20th centuries, the US economy experienced persistent deflation, which made current cash flows less valuable than future cash flows. In that environment of persistent deflation, a normal yield curve was actually inverted. This historical shift underscores how the prevailing economic regime, particularly regarding inflation or deflation, fundamentally influences the curve's typical shape.
Notable instances of extreme curve shapes have provided clear signals. In January 2010, the gap between yields on two-year US Treasury notes and 10-year notes widened to 2.92 percentage points, its highest ever, signalling a steep curve at the outset of recovery from the Great Recession. Strongly inverted yield curves have been reliable precursors to economic recessions in the modern era. For example, the yield curve inverted in 2006 and 2007, preceding the global financial crisis, and again inverted in the first half of 2019. The phenomenon of falling long-term rates alongside rising short-term rates has been termed Greenspan's Conundrum, highlighting situations where the curve behaves in seemingly contradictory ways due to technical factors like a global flight to safety.
- In the 19th and early 20th centuries, persistent deflation led to normally inverted curves.
- In January 2010, the 2-year to 10-year US Treasury spread hit a record 2.92 percentage points.
- Every US recession since 1970 has been preceded by an inverted yield curve (10-year vs 3-month).
- The yield curve inverted in 2006 to 2007 before the global financial crisis.
- The curve inverted again in the first half of 2019.
- Greenspan's Conundrum describes falling long-term rates amid rising short-term rates.
Risks and Limitations of Yield Curve Analysis
While a powerful indicator, relying solely on the yield curve for economic forecasting carries inherent risks and limitations. The predictive relationship, particularly between an inverted curve and a subsequent recession, is based on historical patterns, which may not hold in future economic environments shaped by unprecedented monetary policy or global events. The curve can be influenced by technical factors unrelated to growth expectations, such as large-scale asset purchases by central banks, which can artificially suppress long-term yields and distort the signal. Furthermore, global capital flows and demand for safe-haven assets, like Government of Canada bonds from international investors, can flatten or invert the curve independently of domestic economic conditions.
Different segments of the curve can sometimes tell conflicting stories. For instance, the spread between the 2-year and 10-year bond might be positive while the spread between the 3-month and 10-year is negative, leading to mixed signals. The theories explaining the curve, such as expectations theory and liquidity premium theory, are simplifications of complex market behaviours and do not fully capture all driving forces. Investors should also remember that the government bond yield curve reflects expectations for risk-free rates, whereas the actual borrowing costs for corporations and individuals include additional credit and liquidity spreads that may not move in tandem with the government curve.
- Historical patterns may not hold under unprecedented monetary policy.
- Central bank asset purchases can artificially suppress long-term yields.
- Global capital flows and safe-haven demand can distort the curve.
- Different term spreads (e.g., 2y10y vs 3m10y) can give conflicting signals.
- Economic theories are simplifications of complex market behaviour.
- Corporate borrowing costs include credit spreads not shown on the government curve.
Frequently asked questions
What does an inverted yield curve mean for Canada?
An inverted yield curve in Canada, where short-term Government of Canada bond yields exceed long-term yields, is historically a signal of potential economic trouble. It suggests that investors expect future interest rates to fall, often due to an anticipated economic slowdown or recession. While not a guarantee, every US recession since 1970 has been preceded by an inverted yield curve, and the Canadian curve often moves in a similar pattern. It can also signal that the market believes inflation will remain low in the future.
How does the Bank of Canada use the yield curve?
The Bank of Canada monitors the Government of Canada yield curve as a key indicator of market expectations for future economic growth, inflation, and interest rates. The shape of the curve influences the Bank's decisions on setting its target for the overnight rate, which is its primary monetary policy tool. A steep curve might suggest room for economic growth, while a flat or inverted curve could signal the need for a more accommodative policy stance. The Bank also publishes benchmark yield curve data sourced from CanDeal Data and Analytics.
What is the difference between a government yield curve and a swap curve?
A government yield curve is constructed from the yields of bonds issued by a national government, like the Government of Canada, representing risk-free rates. A swap curve is built from interest rate swaps and reflects the cost of interbank funding and derivatives pricing. Swap curves typically sit above government curves for the same currency because they incorporate the credit risk of the banking sector. Corporate yield curves are often quoted as a credit spread over the swap curve, indicating the additional risk of the corporate issuer.
Can the yield curve predict stock market performance?
The yield curve is not a direct predictor of stock market performance, but its shape can signal the economic environment that affects corporate profits and equity valuations. An inverted curve, which forecasts a potential recession, is often associated with subsequent stock market declines as earnings fall. Conversely, a steepening curve at the start of an economic expansion can coincide with improving corporate outlooks and rising stock markets. However, many other factors drive stock prices, so the curve should be considered alongside other indicators.
What causes a yield curve to become flat or humped?
A flat yield curve occurs when yields are similar across all maturities, while a humped curve has medium-term yields higher than both short and long-term yields. These shapes often signal economic uncertainty and can occur when the market is transitioning between expectations for growth and recession. They may result from the Bank of Canada raising short-term rates to combat inflation while long-term investors remain skeptical about sustained growth, keeping long-term yields subdued. A flat or humped curve can precede a reversion to normal or a full inversion.
What is the normal slope of the Canadian yield curve?
Since 1990, a normal Canadian yield curve has typically shown yields on 10-year Government of Canada bonds approximately 1.4 percentage points higher than the yield on 3-month Treasury bills. This positive slope is the common expectation where yields rise as maturity lengthens. It reflects compensation investors require for the greater risks associated with longer-term investments, such as uncertainty about future inflation and interest rates. A positively sloped curve is often a harbinger of inflationary growth and is considered the typical shape outside of periods with persistent deflation. The specific spread of 140 basis points serves as a key benchmark for assessing the curve's shape.
Sources and further reading
- Yield curve (Wikipedia) en.wikipedia.org
- Selected bond yields bankofcanada.ca
- Canada Government Bonds, Yields Curve worldgovernmentbonds.com
- What is a yield curve? fidelity.ca
This article explains how things work and is not financial, tax or legal advice. Rules, limits and rates change, so check the current figures with the Canada Revenue Agency, your province or your financial institution before you act.