The history of Canada's inflation rate reveals significant periods of price volatility that have shaped the nation's economy and policy. The average annual inflation rate in Canada from 1915 to 2026 is 3.13 percent, with extremes ranging from a record high of 21.60 percent in June 1920 to a low of -17.80 percent. Major inflationary episodes, particularly in the 1970s and 1980s, were driven by food and energy price shocks and aggressive monetary policy responses. Understanding this history is crucial for Canadians as it provides context for current price changes, influences interest rates on mortgages and savings, and highlights the ongoing challenge of price stability for policymakers.
Defining Inflation and the Consumer Price Index
Inflation in Canada is most commonly measured by the Consumer Price Index, a statistical measure produced by Statistics Canada. The CPI tracks the retail price changes of a fixed basket of goods and services representative of typical Canadian household purchases. The rate of inflation refers to the percentage increase in this price level, usually expressed as an annual rate. For example, if the CPI rises from 100 to 132 over two years, the price level has increased by 32 percent, representing an average annual inflation rate of about 16 percent. This measure helps quantify the erosion of purchasing power over time, a fundamental concern for household budgeting and long-term financial planning. The Bank of Canada uses the CPI and related core measures to guide its monetary policy decisions aimed at maintaining price stability.
Beyond the headline CPI, the Bank of Canada relies on three preferred measures of core inflation to filter out volatile price movements. CPI-trim excludes the 20 percent of weighted monthly price variations at both the bottom and top of the distribution of price changes, effectively removing 40 percent of the CPI basket each month. CPI-median identifies the price change at the 50th percentile of the distribution, which helps filter out extreme movements on either side. CPI-common uses a statistical factor model to detect common price changes across all categories in the CPI basket. These core measures provide a clearer view of underlying, persistent inflationary trends by removing temporary shocks from specific components like food and energy. This methodological approach is crucial for policymakers to distinguish between broad-based inflation and sector-specific price spikes.
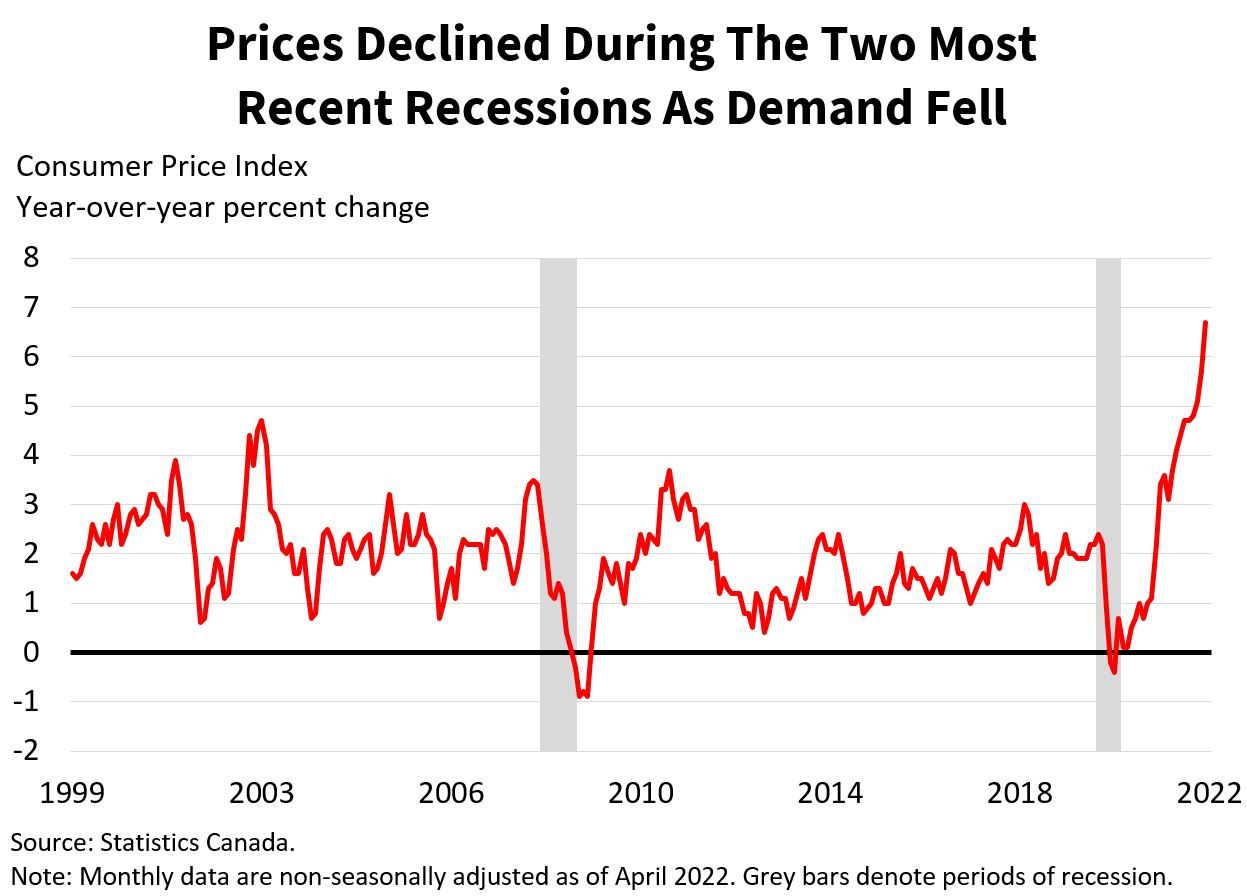
Historical Overview and Major Inflationary Periods
The long-term history of Canadian inflation is marked by periods of significant volatility, often linked to major global events. From 1915 to 2026, the average annual inflation rate in Canada was 3.13 percent. The highest recorded rate was 21.60 percent in June 1920, a period following the First World War. The record low was -17.80 percent, indicating a severe period of deflation. Throughout the 19th and 20th centuries, most sharp inflationary spikes were associated with major wars, and since the Second World War, prices have generally trended upward. This historical pattern underscores how external shocks can rapidly alter domestic price stability and economic conditions for Canadian consumers and businesses.
The post-war era saw Canada experience inflation rates comparable to other developed nations. From 1970 to 1975, Canada's average annual inflation rate was 7 percent, compared to 6.5 percent in the United States and 12 percent in the United Kingdom. By 1981, Canadian inflation reached an annual rate of 12.5 percent. A concerted policy effort brought this figure down to 4.1 percent by 1986, and it fell further to 1.7 percent by 1994. In contrast, the United States saw its average annual CPI rise only 1.1 percent in 1986, the lowest gain in 25 years, and had an inflation rate of 3 percent by 1994. These comparisons highlight the global nature of inflationary forces during this period and the varying success of national policy responses.
The Great Inflation of the 1970s and 1980s
The most significant inflationary period in modern Canadian history occurred from the early 1970s to the mid-1980s, featuring two distinct episodes of double-digit price increases. The first episode ran from 1971 to 1976, triggered by adverse weather in 1973 that caused food prices to jump 18.4 percent. This was compounded by the 1973 oil crisis following the Yom Kippur War, which saw world oil prices quadruple and caused a massive rise in gasoline prices. By December 1974, Canadian inflation hit a peak of 12.7 percent, and the economy subsequently entered a recession. This period demonstrated how combined shocks to food and energy could rapidly drive overall price levels higher and destabilize the broader economy.
The second inflationary spike was an echo of the first, running from 1977 to 1983. In 1978, meat prices skyrocketed by 70 percent, causing the overall food index to rise by 20.2 percent. The Iranian Revolution then triggered the 1979 Oil Crisis, followed by the Iran-Iraq war in 1980, resulting in another doubling of oil prices. Canadian gasoline prices rose by 45.5 percent in 1981, pushing the Canadian CPI to an all-time high for the period of 12.9 percent. In response to this persistent inflation, the Bank of Canada joined the Federal Reserve's aggressive monetary tightening. The Bank of Canada's policy rate was hiked to a high of 21 percent in 1981, causing the five-year fixed mortgage rate to reach 21.5 percent. This lifted the shelter component of CPI to 15.9 percent in 1981, led by a 25 percent rise in mortgage interest costs. The combination of soaring inflation and extremely tight monetary policy led to recessions in early 1980 and again in mid-1981.
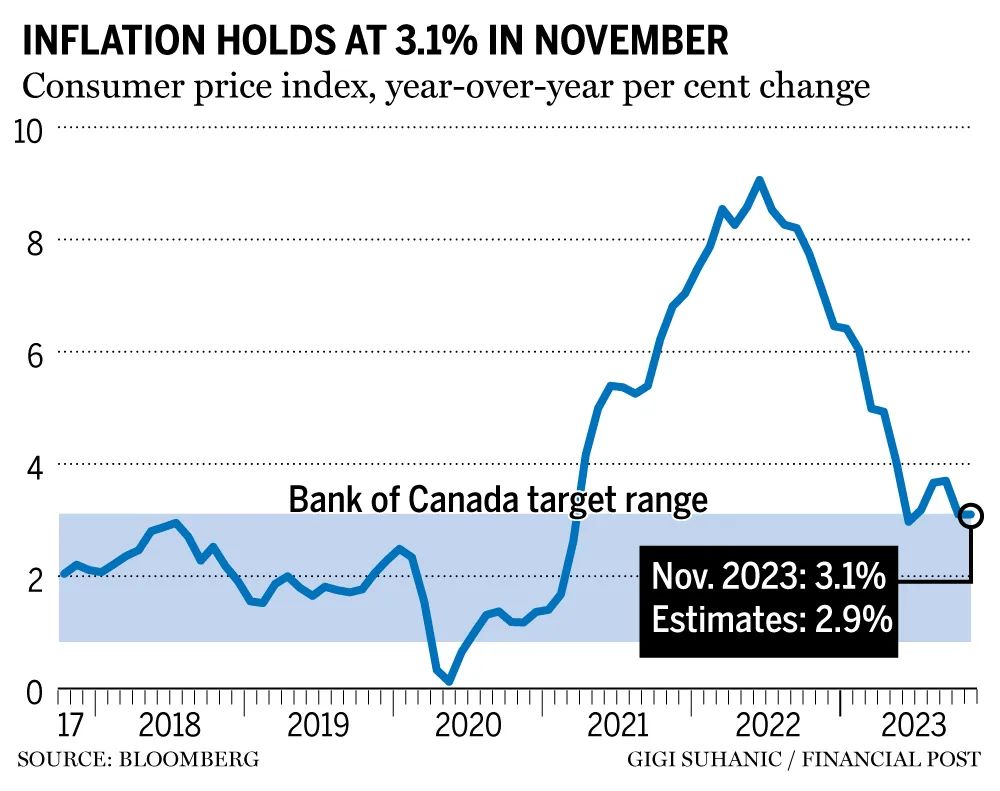
Key Drivers of Inflation Over Time
Throughout history, specific components of the consumer basket have consistently played an outsized role in driving inflation in Canada. The shelter component, which includes housing costs, constitutes 30 percent of the CPI basket and is often the largest single contributor. During the high inflation of 1981, the shelter component rose 15.9 percent, heavily influenced by a 25 percent increase in mortgage interest costs due to high interest rates. In more recent periods, even with negative mortgage interest cost inflation, the shelter component has been a primary driver due to rising house prices and maintenance costs. Food and transportation, particularly energy prices, have also been critical triggers for broader inflationary episodes, as seen in the 1970s and 1980s.
The behavioural impact of frequent purchases significantly affects the public's perception of inflation. Canadians feel the impact of rising food and fuel prices more acutely than other less frequent purchases. For instance, during the high inflation period of the early 2020s, food prices jumped 7.7 percent annually, with beef prices up 14.1 percent and butter up 16 percent. The transportation index jumped 11.2 percent, driven by a 39.8 percent surge in gasoline prices following geopolitical events. These categories, while not always the largest by weight, command significant attention because they are purchased regularly, shaping household sentiment about the cost of living regardless of the broader CPI trend. This phenomenon explains why inflation can feel high even when the headline rate is moderate, as frequent, emotionally salient purchases dominate personal experience.
Inflation's Impact on Income and Economic Policy
Inflation fundamentally affects the relationship between money income and real purchasing power, leading to significant redistributive effects within the economy. If money income rises at the same rate as prices, real income remains unchanged. For real income to increase, money income must outpace inflation. A critical consequence of unexpected inflation is the redistribution of real income from lenders to borrowers. For example, if someone borrows $100 at a 2 percent interest rate and inflation is 5 percent, the lender is repaid with dollars that have less purchasing power than originally lent. This harms fixed-income groups like pensioners who receive payments that are worth less than anticipated when they contributed to their funds during periods of low inflation.
Governments and central banks have historically used a mix of tools to combat inflation, each with different economic trade-offs. Inflation can be reduced by decreasing aggregate demand through fiscal policy, such as cutting government expenditure or raising taxes, and through monetary policy, by restricting money supply growth to raise interest rates and reduce credit. However, these measures often initially reduce output and employment before slowing price increases. Consequently, governments have sometimes implemented wage and price controls, though these are generally ineffective alone. Most economists agree that sustained inflation requires an increasing money supply, with monetarists emphasizing direct control of the money supply and Keynesians often favouring a broader set of tools, including controls used alongside appropriate monetary and fiscal policy. The choice of policy tool reflects differing economic theories about the primary causes of inflation and the desired speed of adjustment for the economy.
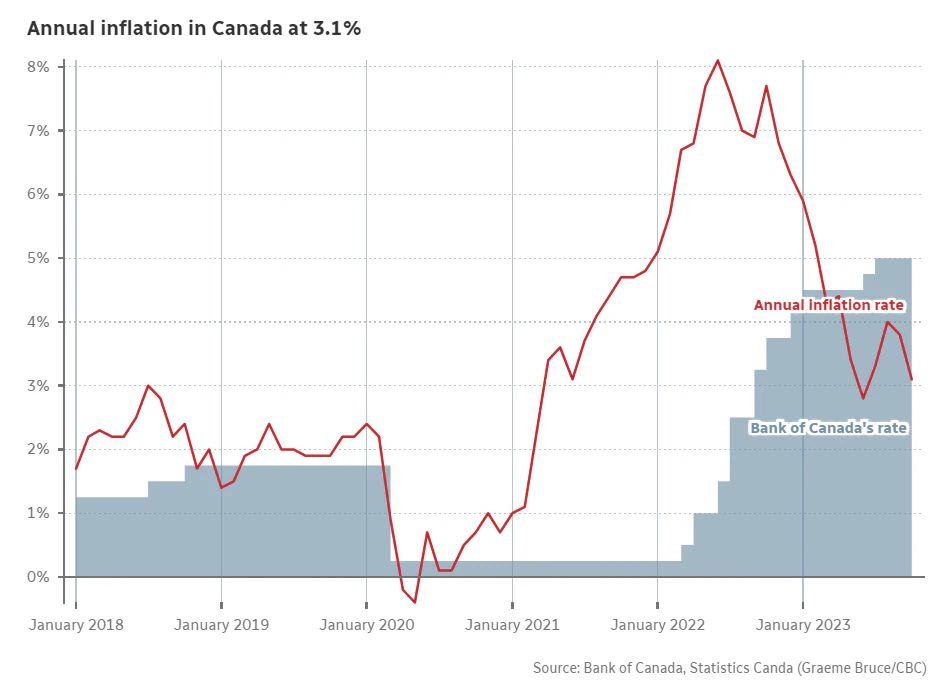
Recent Inflation Trends and Comparative Data
Recent history shows a return of significant inflationary pressures after a prolonged period of relative stability. The drivers mirrored past episodes, with shelter, transportation, and food responsible for nearly 80 percent of the inflation despite constituting only 62 percent of the CPI basket. This broadening of inflation beyond initial pandemic-induced supply shocks and commodity price spikes presented a renewed challenge for the Bank of Canada. The annual average CPI for Canada in 2025 was 164.2, representing a 2.1 percent increase from the previous year, and the inflation rate for 2025 was 2.07 percent, a 0.31 percent decline from 2024.
The following table shows historical annual inflation rates for Canada from 2016 to 2025, illustrating the recent volatility. The inflation rate was 2.0 percent in 2016 and 2.1 percent in 2017. It then decreased to 1.7 percent in 2018 before rising again to 1.4 percent in 2019. The rate for 2025 was 2.07 percent, which represented a decline from the 2024 rate of 2.38 percent.
| Year | Inflation Rate |
|---|---|
| 2025 | 2.07% |
| 2024 | 2.38% |
The rate for 2025 was a 0.31 percent decline from 2024, continuing the disinflationary trend. These figures are calculated using Statistics Canada's CPI, which compares the cost of a fixed basket of goods and services over time. The Bank of Canada's inflation-control target, renewed in 2016, aims to keep CPI inflation at the 2 percent midpoint of a 1 to 3 percent target range, providing a benchmark for evaluating these historical rates. The target renewal in 2016 reaffirmed the commitment to this framework as the central element of Canadian monetary policy.
Frequently asked questions
What was the highest inflation rate in Canadian history?
The highest inflation rate in Canadian history was 21.60 percent, recorded in June 1920. This extreme spike occurred in the period following the First World War. In the modern era, the peak during the Great Inflation of the 1970s and 1980s was 12.9 percent in 1981. The record low for inflation, indicating severe deflation, was -17.80 percent.
What caused the high inflation in Canada in the 1970s and 1980s?
High inflation in the 1970s and 1980s was caused by two distinct episodes driven by food and energy price shocks. The first episode (1971 to 1976) featured adverse weather spiking food prices and the 1973 oil crisis. The second (1977 to 1983) saw meat prices soar by 70% in 1978 and the 1979 Oil Crisis. The Bank of Canada's response, hiking interest rates to 21% in 1981, further increased inflation via mortgage costs before eventually curbing it.
How is the Consumer Price Index (CPI) calculated in Canada?
Statistics Canada calculates the CPI by tracking price changes for a fixed basket of goods and services representing typical Canadian household purchases. The annual inflation rate is the percentage change in this index over 12 months. The Bank of Canada also uses three core inflation measures: CPI-trim (excludes extreme price moves), CPI-median (tracks the 50th percentile price change), and CPI-common (detects common price changes across categories) to gauge underlying trend inflation. CPI-trim excludes 20 percent of weighted monthly price variations at both the bottom and top of the distribution of price changes.
What is the Bank of Canada's role in controlling inflation?
The Bank of Canada's primary role is to conduct monetary policy to preserve the value of money by keeping inflation low, stable, and predictable. It uses its policy interest rate to influence broader credit conditions and economic activity to meet its inflation-control target. This target, renewed in 2016, aims to keep CPI inflation at the 2 percent midpoint of a 1 to 3 percent target range. Historically, as in 1981, the Bank has raised rates aggressively to combat high inflation.
How does inflation affect Canadian households?
Inflation erodes the purchasing power of money, meaning a dollar buys less over time. It redistributes real income, often from lenders to borrowers and harms those on fixed incomes, like pensioners. Key components like shelter (30% of the CPI basket), food, and gasoline have a major impact on living costs because they are purchased frequently. High inflation in the 1980s directly increased mortgage interest costs by 25%, significantly affecting homeowners.
What is the long-term average inflation rate in Canada?
From 1915 until 2026, the average annual inflation rate in Canada is 3.13 percent. This long-term average encompasses periods of extreme volatility, including the post-WWI high, the Great Depression deflation, the stable post-war decades, and the Great Inflation of the 1970s and 1980s. More recently, the rate for 2025 was 2.07 percent, slightly above the Bank of Canada's 2 percent target midpoint. The inflation rate reached an all time high of 21.60 percent in June of 1920.
Sources and further reading
- Inflation: Definitions, graphs and data bankofcanada.ca
- Canadian Inflation: A New Vintage, TD Economics economics.td.com
- Inflation in Canada thecanadianencyclopedia.ca
This article explains how things work and is not financial, tax or legal advice. Rules, limits and rates change, so check the current figures with the Canada Revenue Agency, your province or your financial institution before you act.