The unemployment rate in British Columbia is a key indicator of the province's economic health, measuring the percentage of the labour force that is actively seeking work but unable to find it. As of September 2026, the seasonally adjusted unemployment rate for British Columbia was 6.4%, edging down from 6.5% in August. This rate fluctuates monthly due to economic conditions, industry performance, and seasonal factors, and it often differs significantly from the national average and varies across the province's regions. Understanding this rate and its components provides insight into job market challenges, regional economic disparities, and the overall well-being of workers in British Columbia.
Current Provincial Unemployment Rate and Trends
British Columbia's unemployment rate is reported monthly by Statistics Canada through the Labour Force Survey. The most recent data shows the seasonally adjusted rate at 6.4% for September 2026, a slight decrease from 6.5% in August. This recent figure is lower than the long-term average of 7.98% for the province. The rate has shown volatility throughout 2026, reaching a peak of 6.7% in March, which was the highest level in about a decade outside of the early COVID-19 pandemic years. Employment in the province fell by 20,200 positions in September, with losses in both full-time and part-time work. Despite the job losses, the unemployment rate declined because both the labour force and the number of unemployed individuals also decreased.
Month-to-month changes are influenced by broader economic forces and specific provincial circumstances. For instance, in August 2026, the rate climbed to 6.5% as the province shed 5,500 jobs, surpassing the national average of 6.4% at that time. Political interpretations of these fluctuations vary, with government officials sometimes attributing job losses to external factors like international tariffs, while opposition parties may link them to provincial policy. The data is considered volatile, and trends are often assessed on a year-over-year basis to smooth out monthly fluctuations. Comparing September 2026 to a year prior, the provincial unemployment rate was identical at 6.4%, indicating a period of relative stability in the labour market following earlier increases.

How British Columbia Compares to the National Average
The unemployment rate in British Columbia frequently differs from the Canadian national average, reflecting the unique structure of the provincial economy. In September 2026, the British Columbia rate of 6.4% was slightly below the national rate of 6.5%. This relationship is not static and has reversed in recent months. For example, in August 2026, British Columbia's rate of 6.5% was higher than the national average of 6.4%. Historically, British Columbia has experienced periods of stronger labour market performance relative to the country as a whole. In 2019, the province's unemployment rate was 4.7%, significantly lower than Canada's rate of 6.9% at that time.
Economists monitor these comparisons to gauge regional economic strength. In March 2026, Douglas Porter, chief economist at Bank of Montreal, noted that British Columbia registered as by far the weakest province in the country over the preceding year. During that month, both the national and British Columbia unemployment rates were identical at 6.7%. The provincial economy's sensitivity to specific industries, such as forestry and manufacturing which are heavily affected by international trade policies, can cause its performance to diverge from the national trend. These sectors face challenges from tariffs, which can lead to job losses that disproportionately impact British Columbia.
Regional Unemployment Rates Within British Columbia
Unemployment is not evenly distributed across British Columbia, with significant variations between economic regions, metropolitan areas, and smaller communities. Statistics Canada and the provincial government track unemployment at the economic region level, which is also used for setting Employment Insurance regional rates of unemployment. As of the latest data, the unemployment rate was lowest in the Kootenay region and highest in the Thompson, Okanagan region. Other specific regional rates have been reported, including 5.8% for Vancouver Island and the Coast, 8.1% for the Southern Interior, and 6.9% for the Abbotsford area.
Major urban centres show their own distinct trends. Vancouver's unemployment rate has been reported at 6.6%, while Victoria's rate was lower at 5.7%. City-level data can show mixed movement even within the same month. The Community of Chilliwack saw improvement during that period, with unemployment falling to 6.0% from 7.2%. These disparities highlight how local economies, dependent on different industries like tourism, agriculture, or resource extraction, experience the broader labour market trends in unique ways. The regional rates are crucial for understanding where economic hardship is most concentrated within the province.
- Kootenay region has the lowest unemployment rate.
- Thompson, Okanagan region has the highest unemployment rate.
- Vancouver Island and Coast region reported a 5.8% rate.
- Southern Interior region reported an 8.1% rate.
- Abbotsford area reported a 6.9% rate.
- Vancouver's rate has been reported at 6.6%.
- Victoria's rate has been reported at 5.7%.
Key Industries and Employment Trends
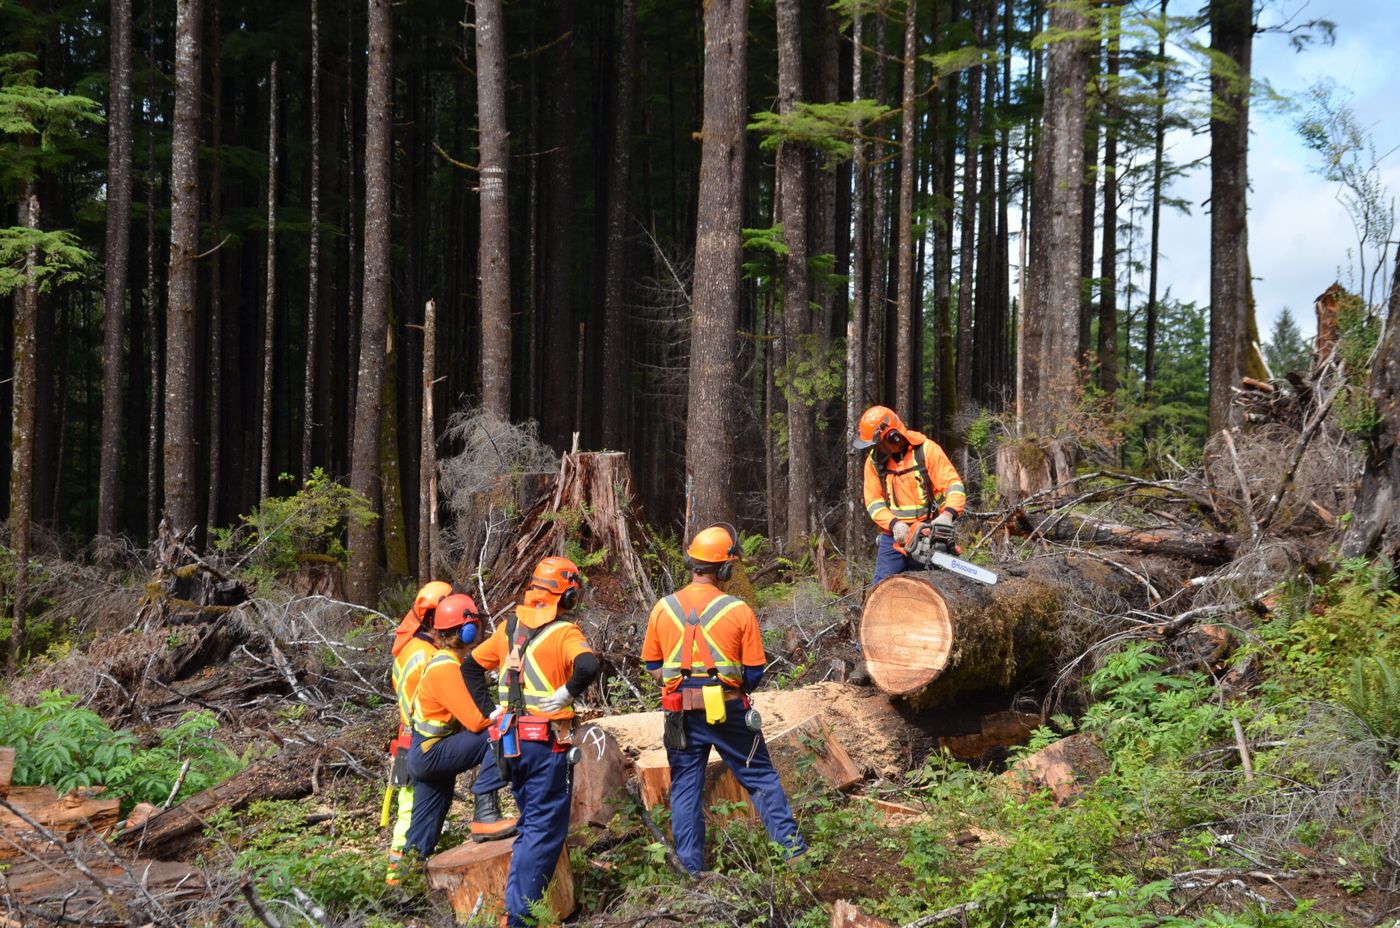
Employment changes in specific industries are a primary driver of fluctuations in the overall provincial unemployment rate. The forestry, fishing, mining, quarrying, and oil and gas sector has faced significant challenges, decreasing by 4,400 jobs year-over-year in September 2026, largely due to losses in forestry. Specific mill closures and operational scale-downs, such as the loss of 53 positions at a Prince George lumber plant and layoffs in Houston, have been cited, with companies pointing to fibre supply challenges and tariffs. The manufacturing sector has also contracted, losing about 6,500 jobs compared to September 2025, a decline of 3.4%.
Trade tensions with the United States have created direct challenges for manufacturers. A Langley-based aluminum manufacturer reported that combined U.S. tariffs would add 100% to its selling price, leading it to lay off 50% of its staff. In contrast, some sectors show growth and resilience. The health care and social assistance sector saw employment increase by 8.0% year-over-year in September 2026, adding 32,600 jobs, though acute labour shortages persist in occupations like community paramedicine. The construction sector has also been a source of job gains, adding 2,800 jobs in March 2026, with expectations for more roles as the summer building season approaches. Retail and wholesale trade, however, have seen substantial job losses, with nearly 10,000 positions lost in March 2026.
- Forestry sector lost 4,400 jobs year-over-year in September 2026.
- Manufacturing sector lost about 6,500 jobs compared to September 2025.
- Health care and social assistance added 32,600 jobs year-over-year in September 2026.
- Construction sector gained 2,800 jobs in March 2026.
- Retail and wholesale trade lost nearly 10,000 jobs in March 2026.
- A Langley aluminum manufacturer laid off 50% of its staff due to tariffs.
Historical Context and Recent Volatility
The British Columbia unemployment rate has a history of fluctuation, with recent years showing particular volatility. The rate reached 6.7% in March 2026, which was noted as the highest level in about a decade, excluding the first couple of years of the COVID-19 pandemic. This marked a sharp jump from 6.1% in February 2026, which itself had seen significant job losses. The period from May to July 2026 was stronger, with 50,800 jobs added to the provincial economy according to government statements. Year-to-date figures for 2026 showed employment up by 27,000 jobs, led by a 46,000 increase in full-time positions.
The long-term average for the British Columbia unemployment rate is 7.98%, indicating that recent rates, while higher than the 2019 low of 4.7%, are still below the historical mean. The pandemic caused unprecedented disruption, but the labour market had largely recovered before the increases seen in early 2026. Economists describe monthly labour market data as notoriously volatile, advising that multi-month or year-over-year trends provide a clearer picture. The increase in the unemployment rate in early 2026 followed a period of sustained improvement, demonstrating the cyclical nature of provincial job markets. External shocks, such as the implementation of new U.S. tariffs in late August 2026, are noted as factors that can influence future data, though their immediate impact on a given month's report may be limited.
- March 2026 rate of 6.7% was the highest in about a decade (excluding early pandemic).
- February 2026 rate was 6.1%.
- From May to July 2026, 50,800 jobs were added.
- Year-to-date 2026 employment was up 27,000 jobs.
- Full-time jobs increased by 46,000 year-to-date in 2026.
- The long-term average unemployment rate is 7.98%.
- The 2019 unemployment rate was 4.7%.
Demographic Factors and Youth Unemployment
Unemployment affects demographic groups differently, with youth often experiencing disproportionately higher rates. In March 2026, the unemployment rate for people aged 15 to 24 in British Columbia rose sharply to 17.1%, up from 14.4% the month before. This high rate indicates that young job-seekers face a particularly tough market, bearing the brunt of economic downturns as they often work in entry-level or service-sector positions that are more susceptible to cuts. The overall provincial rate for that month was 6.7%, showing that youth unemployment was more than two and a half times higher.
Other labour force characteristics are also monitored. The participation rate represents the number of people in the workforce as a percentage of the working-age population and is a key metric for understanding labour market engagement. Average hourly wages across Canada have been rising, with a year-over-year increase of 4.7% noted in March 2026, the fastest pace since October 2024. Statistics Canada has indicated that some of this wage growth is due to the composition of employment, meaning the economy is not adding or maintaining as many lower-paying jobs that typically pull down the average. This shift in the types of jobs available can influence overall economic well-being even as the unemployment rate changes.
Sources of Data and How to Interpret Them
The primary source for British Columbia unemployment data is Statistics Canada's Labour Force Survey, conducted monthly. The survey provides seasonally adjusted and unadjusted figures for the province, its economic regions, and specific industries. The Province of British Columbia, through BC Stats, provides a Labour Market Monthly Update and a public dashboard that offers an overview of the labour market, including employment by industry and occupation. This dashboard was updated in September 2026 with new features, report-ready charts, and downloadable data tables.
When interpreting the data, it is important to understand the definitions. The unemployment rate specifically measures those who are without work, are available for work, and have actively looked for work in the past four weeks. It does not include people who have stopped looking for work. The data is subject to revision and is a sample-based estimate. The regional rates of unemployment produced by Statistics Canada are used officially by the Employment Insurance program to determine the number of insurable hours required to qualify and the duration of benefits. Citizens can view a variety of data tables and submit feedback or requests for more information through the BC Stats request system to access the most detailed and current information.
Frequently asked questions
What is the current unemployment rate in British Columbia?
As of the latest monthly data, the seasonally adjusted unemployment rate in British Columbia is 6.4 percent. This rate is based on Statistics Canada's Labour Force Survey. The rate can change each month with new economic data releases. For example, it was 6.5 percent in August 2026 before decreasing slightly.
How does British Columbia's unemployment rate compare to Canada's?
In September 2026, British Columbia's unemployment rate of 6.4 percent was slightly lower than the national rate of 6.5 percent. The relationship between provincial and national rates fluctuates monthly. In August 2026, British Columbia's rate of 6.5 percent was higher than the Canadian average of 6.4 percent. Historically, the provincial rate has often been below the national average.
What was the highest recent unemployment rate in British Columbia?
The unemployment rate reached 6.7 percent in March 2026. This was reported as the highest rate in about a decade, excluding the early years of the COVID-19 pandemic. This increase from 6.1 percent in February 2026 coincided with a loss of 19,000 jobs. Significant job losses occurred in sectors like retail and wholesale trade during that period.
Why did British Columbia's unemployment rate increase in early 2026?
The increase to 6.7 percent in March 2026 was primarily due to the loss of 19,000 jobs. Major declines were seen in retail and wholesale trade, finance, real estate, and professional services. Officials cited broader global pressures, including the impact of U.S. tariffs, as contributing factors. These tariffs created challenges for key export industries like forestry and manufacturing.
What is the youth unemployment rate in British Columbia?
The youth unemployment rate is consistently higher than the overall provincial rate. In March 2026, the rate for people aged 15 to 24 rose to 17.1 percent. This was an increase from 14.4 percent the previous month. This indicates that young job seekers face a more difficult labour market than the general working-age population.
Which region in British Columbia has the highest unemployment?
The Thompson, Okanagan region has the highest unemployment rate in British Columbia. This is based on unadjusted labour market indicators. Other regions with notably high rates include the Southern Interior at 8.1 percent and Abbotsford at 6.9 percent. In contrast, areas like Victoria had a lower rate of 5.7 percent. The Vancouver Island and Coast region was recorded at 5.8 to 6.0 percent. These regional disparities reflect differing local economic conditions and industry performance across the province.
Sources and further reading
- Labour Market Monthly Update workbc.ca
- B.C.'s unemployment rate went up in August dailyhive.com
- British Columbia, August 2026 - Job market snapshot jobbank.gc.ca
- Labour Market Statistics, Province of British Columbia www2.gov.bc.ca
- B.C.'s March unemployment rate hit 6.7%, highest since ... cbc.ca
This article explains how things work and is not financial, tax or legal advice. Rules, limits and rates change, so check the current figures with the Canada Revenue Agency, your province or your financial institution before you act.