Unemployment in Canada refers to the unused supply of labour within the national labour force. The unemployment rate, a key economic indicator, measures this condition as a percentage of people aged 15 and over who are either employed or actively seeking work. Statistics Canada's monthly Labour Force Survey provides the official data, tracking changes in employment and joblessness across provinces and territories. Understanding unemployment is crucial for assessing economic health, informing government policy, and administering the Employment Insurance system that supports eligible workers during periods without work.
Definition and Measurement
In Canada, unemployment is officially defined as the unused supply of labour within the labour force. The labour force itself consists of all individuals aged 15 years and over who are either employed or unemployed. The unemployment rate is the primary metric, calculated by dividing the number of unemployed people by the total number of people in the labour force and expressing the result as a percentage. Statistics Canada is the federal agency responsible for producing official labour market statistics. Its monthly Labour Force Survey samples approximately 56,000 representative households across all provinces and territories, covering about 100,000 people, though it excludes residents of First Nations reserves, military personnel, and institutional populations.
An individual is classified as unemployed if, during the survey reference week, they were without work, were available for work, and met one of three specific criteria. They must have actively looked for work in the past four weeks, been on temporary layoff with an expectation to return to their job, or been waiting for a new job to start within four weeks. The employed category includes anyone who performed paid work as an employee or through self-employment, or who did unpaid family work contributing directly to a family-run farm or business. People not in the labour force, such as full-time students, retirees, or those unable or unavailable to work, are counted separately and do not factor into the unemployment rate calculation.

Historical Trends in Unemployment
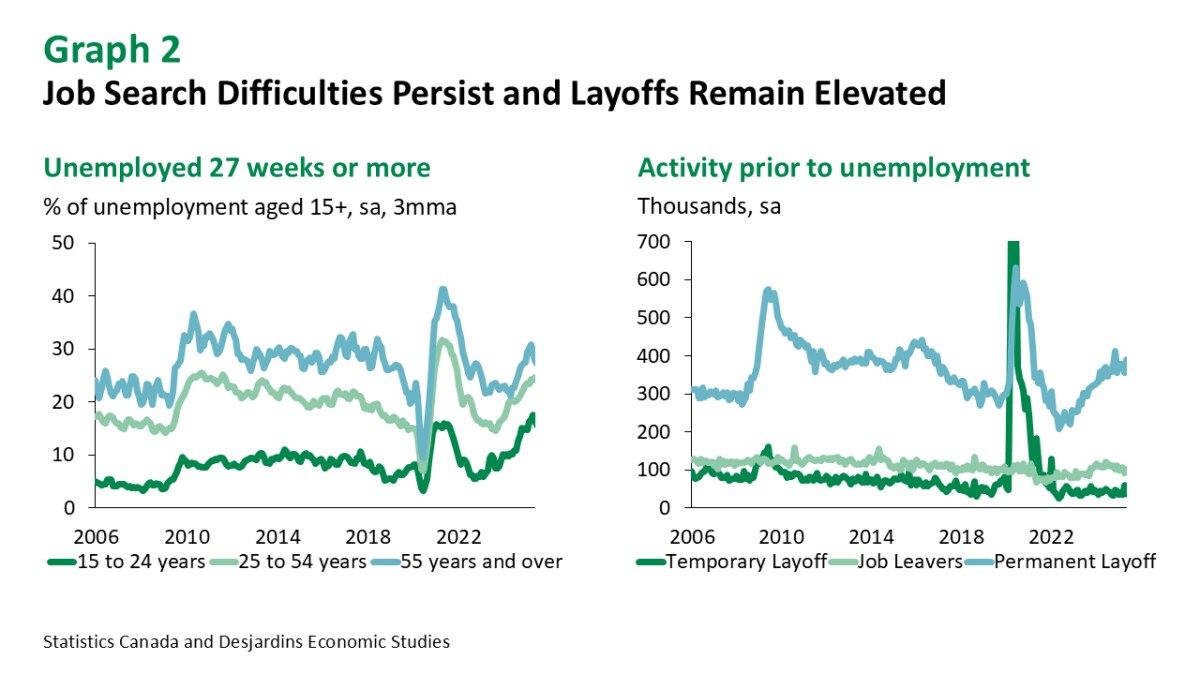
Canada's unemployment rate has fluctuated significantly throughout its modern economic history, influenced by global events, domestic policy, and economic cycles. The lowest recorded national unemployment rate was 2.2% in 1947, a period marked by a smaller pool of available workers following the Second World War. During the Great Depression, urban unemployment across Canada reached 19%, with Toronto's rate at 17% according to the 1931 census, though farmers remaining on their land were not counted as unemployed. The post-1975 period saw a general rise in unemployment as labour force growth outpaced employment growth. The recession of the early 1980s precipitated a sharp increase, with the unemployment rate climbing steadily to a peak of 13.1% in December 1982, which remained the highest level recorded until the COVID-19 pandemic. After a gradual reduction to around 7% by the late 1980s, another recession in the early 1990s pushed the rate back up to 12.1% by November 1992. Strong employment growth from 1997 to 2000 brought the rate down to 6.8% by January 1999, and it reached a pre-2008 recession low of 5.8% in October 2007. More recently, youth unemployment hit 14.6% in July 2025, its highest level since 2010 outside of the pandemic period.
Several key dates and rates mark the historical extremes and turning points in Canadian unemployment. The lowest national unemployment rate was 2.2 percent in 1947. The highest level of unemployment throughout Canada was 13.1 percent in December 1982 during the early 1980s recession. During the Great Depression, urban unemployment throughout Canada was 19 percent. Youth unemployment reached 14.6 percent in July 2025, the highest since 2010 outside of the COVID-19 pandemic.
- 1947: Record low national unemployment rate of 2.2%.
- June 1933: Unemployment rate peaked at 19.3% during the Great Depression.
- December 1982: Record high unemployment rate of 13.1% during the early 1980s recession.
- November 1992: Unemployment rate peaked at 12.1% during the early 1990s recession.
- January 1999: Unemployment rate fell to 6.8% after strong late-1990s growth.
- October 2007: Pre-recession low of 5.8% before the 2008-09 downturn.
- July 2025: Youth unemployment hit 14.6%, the highest since 2010 excluding the pandemic.
The unemployment rate was gradually reduced to about 7 percent in the late 1980s, but rose sharply again during the recession of the early 1990s. It peaked at 12.1 percent in November 1992. After that recession, employment recovered slowly, so a drop in the unemployment rate was delayed until 1994. Strong employment growth from 1997 to 2000 brought the unemployment rate down to 6.8 percent in January 1999. Unemployment spiked again briefly in the early 2000s, before resuming its decline in September 2003.
Recent Labour Market Conditions
The Canadian labour market experienced notable shifts in the mid-2020s, reflecting broader economic cooling and external trade pressures. In September 2026, the national unemployment rate inched up to 6.5% from a two-year low of 6.4% in the previous month, which was in line with market expectations. This followed a period of job losses, including a decline of 42,000 jobs in August 2026 where the unemployment rate held steady at 6.4%, surprising economists who had anticipated gains. The job losses in August were concentrated in the public sector, which shed 20,000 positions for a third consecutive month, while private sector employment saw little change. Regionally, Quebec and Ontario were hardest hit, losing 19,000 and 18,000 jobs respectively.
Amid these job losses, wage growth showed signs of slowing. Average hourly wage growth in August 2026 slowed to 2% on an annualized basis, the slowest pace in nearly nine years, down from 2.8% in July and 3.3% in June. The manufacturing sector was a rare bright spot during this period, adding 22,000 jobs in August, while categories including public administration, natural resources and utilities all booked declines. However, industries dependent on exports to the United States faced an uncertain economic context due to historic trade tensions and tariffs, leading to higher layoff rates in those sectors over the preceding year. The share of Canadian exports bound for the U.S. had been trending lower, averaging 76% in 2024, 72% in 2025, and reaching 66% in July 2026, with growth in exports to non-U.S. markets, especially Europe, partly offsetting the decline.
The monthly jobs report for August 2026 highlighted several key statistics that defined the labour market's condition. Canada lost 42,000 jobs in August 2026, which surprised economists. The unemployment rate held steady at 6.4 percent for that month. The manufacturing industry added 22,000 jobs in August. Average hourly wage growth in August slowed to two percent on an annualized basis, which was the slowest pace in nearly nine years.
- Net job change: Loss of 42,000 jobs.
- Unemployment rate: Held steady at 6.4%.
- Public sector job loss: 20,000 positions.
- Manufacturing sector gain: Added 22,000 jobs.
- Regional job losses: Quebec lost 19,000 jobs. Ontario lost 18,000 jobs.
- Average hourly wage growth: Slowed to 2% annually.
- Previous three-month gain: From April to July 2026, the economy added 181,000 jobs.
Friday's data snaps a string of monthly gains. The Canadian economy added 75,000 jobs in July. From April to July, those increases worked out to 181,000 jobs. The latest jobs report comes as historic trade tension between Canada and the United States threatens a wide swath of industries, with the federal government rolling out expanded support programs in response.

Provincial and Territorial Unemployment Rates
Unemployment in Canada is not uniform and varies significantly across provinces and territories due to differing economic structures, industries, and demographic factors. Statistics Canada provides detailed, seasonally adjusted data on unemployment rates for each jurisdiction through its Labour Force Survey. Seasonally adjusted data removes predictable seasonal patterns, such as summer student employment or winter construction slowdowns, to reveal underlying trends, while not seasonally adjusted data reflects the actual current rate. These regional rates are crucial for understanding local economic conditions and for administering federal programs like Employment Insurance, which uses regional unemployment rates to determine benefit duration and eligibility thresholds.
Definitions of what constitutes full employment in the modern economy typically range from 3% to 6% unemployment rates, acknowledging that some level of frictional unemployment is always present as people move between jobs. The unemployment rate is a critical economic indicator used by policymakers, businesses, and analysts to gauge the health of regional economies. It influences decisions on interest rates, government spending, and social program funding. Furthermore, the federal government has at times applied temporary minimum unemployment rates for program purposes, such as the 13.1% rate announced in August 2020 for Employment Insurance economic regions.
Comparison with United States Methodology
Canada and the United States use different methodological measures to calculate their respective unemployment rates, which affects direct international comparisons. The official definitions of who is counted as employed or unemployed differ between the two national statistical agencies. An analyst with the American Bureau of Labor Statistics has stated that if the Canadian unemployment rate were adjusted to U.S. concepts, it would be reduced by approximately 1 percentage point. This difference is important for contextualizing cross-border economic performance, especially given the deep integration of the two economies. In a recent comparative example from August 2026, while Canada's unemployment rate was 6.4%, the United States reported a rate of 4.1% for the same month.
The U.S. Labor Department also reported that American employers added 162,000 jobs that month, alongside revisions that added a combined 55,000 jobs to the June and July figures. These divergent results highlight not only different economic conditions but also the impact of differing measurement approaches. Analysts must account for these methodological distinctions when drawing conclusions about relative labour market strength or when considering policies that may be influenced by cross-border economic performance. The U.S. President at the time celebrated the strong jobs data and linked it to arguments for the Federal Reserve to lower interest rates.
Employment Insurance and Support Programs
The Canadian Employment Insurance program is a fundamental federal social safety net designed to provide temporary financial assistance to eligible workers who lose their jobs through no fault of their own. Eligibility requirements and benefit details are available for workers, self-employed individuals, and Canadians living abroad. The program is closely tied to the unemployment rate, as both the number of regular EI beneficiaries and the rules for benefit duration can be influenced by local and national joblessness levels. For instance, during periods of high unemployment, the government may introduce temporary measures to expand access, such as applying a minimum unemployment rate of 13.1% to all EI economic regions to standardize benefits.
In response to economic shocks, such as trade disputes, the federal government has rolled out expanded economic relief programs. For example, in response to tariffs imposed in 2026, the government introduced a $7.5 billion expanded support program for impacted workers and businesses, which was in addition to nearly $25 billion in tariff support implemented over the previous 18 months. These supports complement the regular EI system and are designed to stabilize incomes and maintain consumer spending during periods of economic uncertainty. The interplay between the measured unemployment rate and the activation of these support programs underscores the practical importance of labour market statistics for public policy.
The rules and supports tied to unemployment levels include several key temporary measures and program details. Employment Insurance benefits provide income support for eligible unemployed workers. Effective August 9, 2020, a minimum unemployment rate of 13.1 percent was applied temporarily for the EI economic regions. The federal government rolled out a 7.5 billion dollar expanded economic relief program for workers and businesses impacted by trade tensions. These supports are in addition to nearly 25 billion dollars in tariff support implemented over the previous 18 months.
- Temporary EI minimum rate: A minimum unemployment rate of 13.1% applied to all EI economic regions effective August 9, 2020.
- 2026 tariff support: A $7.5 billion expanded economic relief program for workers and businesses impacted by tariffs.
- Previous tariff support: Nearly $25 billion in support implemented over the 18 months prior to 2026.
- Eligibility: The EI program covers workers, self-employed people, and Canadians living abroad.
- Benefit determination: Local and regional unemployment rates are used to determine benefit duration and access thresholds.
These supports complement the regular Employment Insurance system and are designed to stabilize incomes and maintain consumer spending during periods of economic uncertainty. In August 2026, U.S. President Donald Trump imposed 50 percent tariffs on about 28 billion dollars worth of Canadian products. Canada responded with dollar for dollar tariffs on 27.6 billion dollars of comparable U.S. goods. Industries dependent on U.S. demand for exports face an uncertain economic context. The share of Canadian exports bound for the U.S. was 66 percent in July 2026, a figure that has been trending lower.
Key Factors Influencing Unemployment
Several interconnected factors influence the level and trajectory of unemployment in Canada. Economic cycles of recession and expansion are primary drivers, as seen in the sharp spikes during the early 1980s and early 1990s recessions. Monetary policy, including interest rate decisions by the Bank of Canada, affects business investment and hiring. For example, the primary cause of the early 1980s recession was a contractionary monetary policy established by the U.S. Federal Reserve System to control high inflation, which impacted the Canadian economy. In the mid-2020s, many economists expected the Bank of Canada to keep its policy rate on hold at 2.25% through at least the remainder of the year, influencing labour market conditions.
Global trade relations and external demand constitute another major factor. Industries dependent on U.S. exports faced significant uncertainty in 2026 due to tariff impositions, which contributed to job losses in affected sectors. Demographic changes, including the entry of large cohorts like millennials into the labour force or the aging of the baby boomer generation, also shape unemployment trends. Technological change can simultaneously create new jobs while rendering others obsolete, leading to structural unemployment. Finally, government fiscal policy, including spending on infrastructure, education, and direct support programs, plays a critical role in stimulating job creation and supporting workers during transitions.
Frequently asked questions
What is the current unemployment rate in Canada?
As of September 2026, the seasonally adjusted unemployment rate in Canada was 6.5%. This represented a slight increase of 0.1 percentage points from the previous month's rate of 6.4%, which had been a two-year low. The rate is published monthly by Statistics Canada based on its Labour Force Survey. It is a key indicator watched by economists, policymakers, and businesses to gauge the health of the Canadian economy.
How does Canada's unemployment rate compare to the United States?
Canada and the United States use different methodologies to calculate unemployment, making direct comparison complex. An analyst from the U.S. Bureau of Labor Statistics has stated that adjusting the Canadian rate to U.S. concepts would lower it by about 1 percentage point. For example, in August 2026, Canada's rate was 6.4% while the U.S. rate was 4.1%. The differences stem from varying definitions of employment and unemployment in the national surveys conducted by Statistics Canada and the U.S. Labor Department.
What is considered full employment in Canada?
In modern economic terms, definitions of full employment in Canada typically range from an unemployment rate of 3% to 6%. This range acknowledges that even in a healthy economy, there will always be some level of frictional unemployment as people transition between jobs or enter the workforce. The specific threshold can vary depending on demographic factors and the structure of the labour market. Policymakers often use this range as a benchmark for assessing whether the economy is operating at its potential.
How is the unemployment rate calculated in Canada?
Statistics Canada calculates the unemployment rate monthly through its Labour Force Survey of approximately 56,000 households. The rate is the percentage of the labour force that is unemployed. The labour force includes all people aged 15 and over who are either employed or unemployed. A person is counted as unemployed if they were without work during the survey week, were available for work, and had looked for work in the past four weeks, were on temporary layoff, or were waiting for a new job to start. The result is expressed as a seasonally adjusted figure to remove predictable seasonal variations.
What was the highest unemployment rate in Canadian history?
The highest unemployment rate in Canadian history was 13.1 percent, recorded in December 1982 during the early 1980s recession. This economic downturn was primarily caused by a contractionary monetary policy established by the United States Federal Reserve System to control high inflation. For context, during the Great Depression, the urban unemployment rate across Canada peaked at 19.3 percent in June 1933, according to historical data. The 1982 record of 13.1 percent is considered the highest level since the Great Depression, based on Statistics Canada's Labour Force Survey data. It resulted from widespread economic factors that originated in the United States affecting the Canadian labour market.
What is youth unemployment in Canada?
According to data from Statistics Canada, youth unemployment hit 14.6 percent in July 2025. This was the highest rate recorded since 2010, outside of the period impacted by the COVID-19 pandemic. The unemployment rate measures the unused supply of labour and is a key economic indicator. Statistics Canada defines unemployed persons as those available for work who are without work and have looked for work in the past four weeks, are on temporary layoff, or are waiting for a new job to begin.
Sources and further reading
- Unemployment in Canada (Wikipedia) en.wikipedia.org
- Unemployment in Canada thecanadianencyclopedia.ca
- Canada lost 42000 jobs in August, surprising economists cbc.ca
- Canadian Employment (September 2026) - TD Economics economics.td.com
This article explains how things work and is not financial, tax or legal advice. Rules, limits and rates change, so check the current figures with the Canada Revenue Agency, your province or your financial institution before you act.