Nominal GDP per capita is a key economic indicator that divides a country's total economic output by its population, expressing the result in current US dollars. It is often used as a rough proxy for average economic well-being, though it does not measure personal income directly. For Canadians, this metric provides a high-level view of how the nation's economic output per person compares globally. Understanding Canada's position and the limitations of this measure is crucial for interpreting economic health and international comparisons.
Definition and Calculation of Nominal GDP per Capita
Nominal gross domestic product per capita is calculated by dividing a country's total gross domestic product by its total population. GDP represents the total market value of all finished goods and services produced within a country's borders in a specific time period. The population figure used is typically the average or mid-year population for the same year as the GDP data. The resulting value is expressed in current United States dollars, using prevailing market exchange rates without any adjustment for international price differences. This calculation produces a single dollar amount that represents the average economic output attributable to each person in the country.
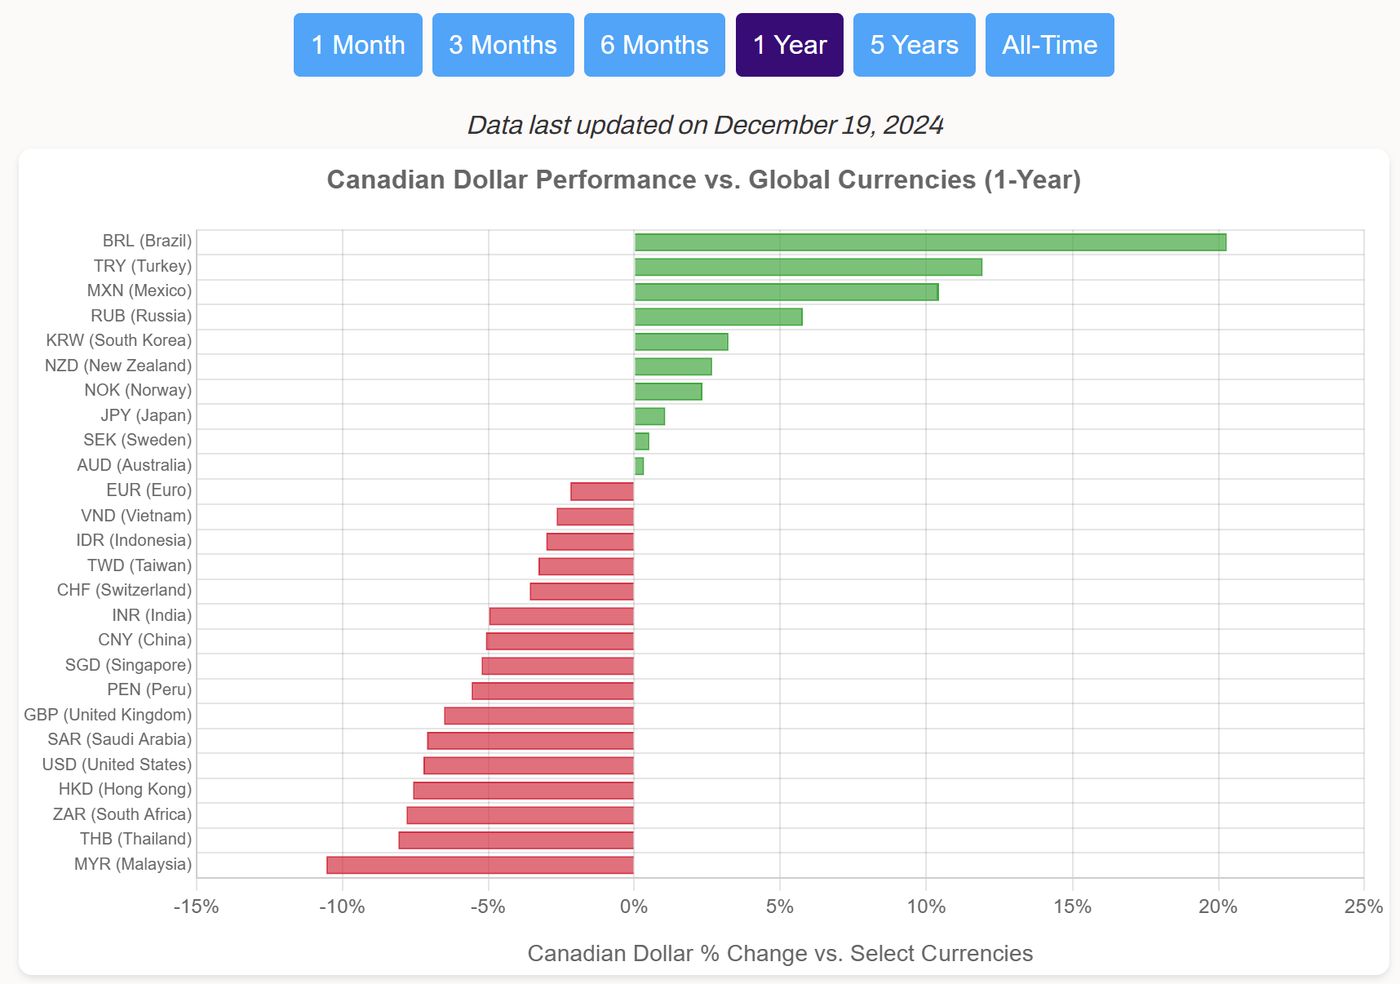
It is critical to understand that this figure is not a measure of average personal income, median income, disposable income, or wages. Rather, it is a macroeconomic metric indicating the relative scale and output of a national economy on a per-person basis. The calculation does not account for income distribution, meaning a high GDP per capita can coexist with significant economic inequality. The metric is also sensitive to fluctuations in a country's currency exchange rate against the US dollar, which can cause rankings to shift from year to year without reflecting real changes in domestic living standards.
Nominal versus PPP GDP per Capita
While nominal GDP per capita uses current exchange rates, GDP per capita based on purchasing power parity applies an adjustment factor to account for differences in the cost of living between countries. PPP calculations express values in a notional currency called international dollars, which aim to equalize the purchasing power of different national currencies. This adjustment means that a dollar's worth of goods and services in one country is theoretically equivalent to a dollar's worth in another. As a result, PPP figures are generally considered a better tool for comparing actual living standards across nations.
PPP largely removes distortions caused by exchange rate volatility, but it introduces its own complexities as it requires extensive estimation of price levels across countries. It does not directly reflect the value of economic output in international trade, which remains tied to market exchange rates. On a global scale, PPP per capita figures tend to show a narrower spread between rich and poor countries compared to nominal figures. For instance, the world average GDP per capita at PPP was around $25,000 as of 2024, which is a population-weighted average of global output adjusted for purchasing power.
Global Rankings and Key Projections
Global rankings by nominal GDP per capita are dominated by smaller, often highly specialized economies. According to IMF projections for 2026, Liechtenstein is expected to rank first, leading second place Luxembourg by nearly $68,000. The top positions frequently see significant gaps, with the 2nd, 3rd, and 4th ranked economies each maintaining a lead of about $15,000 to $20,000 over the next one. In contrast, the rankings become much more competitive further down the list, with the 5th, 6th, and 7th places separated by only narrow margins.
Projected changes within the top ten for 2026 include Iceland overtaking Singapore and the Netherlands replacing Macao. Among the top 50 economies, Guyana is projected to make the largest leap, climbing seven places, while Israel is expected to rise four positions. Conversely, Japan is forecasted to experience the largest decline, falling five places, followed by Qatar dropping four positions. It is noteworthy that among the top ten economies by nominal GDP per capita, only the United States, Switzerland, and the Netherlands also rank among the world's top 20 economies by total nominal GDP, highlighting how smaller populations can lead to high per capita figures.
Distortions in GDP per Capita: The Tax Haven Effect
The nominal GDP per capita metric is particularly vulnerable to artificial inflation in jurisdictions that function as tax havens. In these countries, corporate accounting entries related to tax planning by foreign multinationals can massively distort economic data. For example, Ireland's GDP data has been so distorted that its central bank created a modified measure called Gross National Income star (GNI*) in 2017, which the OECD and IMF now use for the country. In 2015, Ireland's GDP was 143 percent of its GNI*. Globally, an estimated $12 trillion in foreign direct investment positions, representing almost 40 percent of the total, is completely artificial, consisting of financial investments passing through empty corporate shells.
The eight major pass through economies host more than 85 percent of the world's investment in special purpose entities. These entities are often set up for tax reasons. This activity can artificially inflate a country's nominal GDP per capita figures. Economists therefore often examine metrics like Gross National Income per capita alongside GDP per capita. This provides a clearer picture of true domestic economic activity. The list of these prominent jurisdictions includes the Netherlands, Luxembourg, Hong Kong SAR, the British Virgin Islands, Bermuda, the Cayman Islands, Ireland, and Singapore.
Canada's Position and Economic Context
Canada consistently ranks in the upper tier of global economies by nominal GDP per capita. According to International Monetary Fund data for 2026, Canada is projected to hold the 28th position globally with a nominal GDP per capita of $60,105. Other global databases and trackers generally place Canada in a similar range, around the mid-20s in the world rankings. This position reflects Canada's status as a large, developed, resource-rich economy with a relatively high standard of living.
Canada's nominal GDP per capita figure is calculated by dividing its total economic output by its population. The resulting value is then converted to current United States dollars. This conversion means the Canadian dollar's exchange rate directly influences the nominal figure. It is important to understand this figure represents economic output per person, not personal income. It also does not account for differences in the cost of living. Purchasing power parity based comparisons adjust for these cost of living differences.
Limitations and Criticisms of the Metric
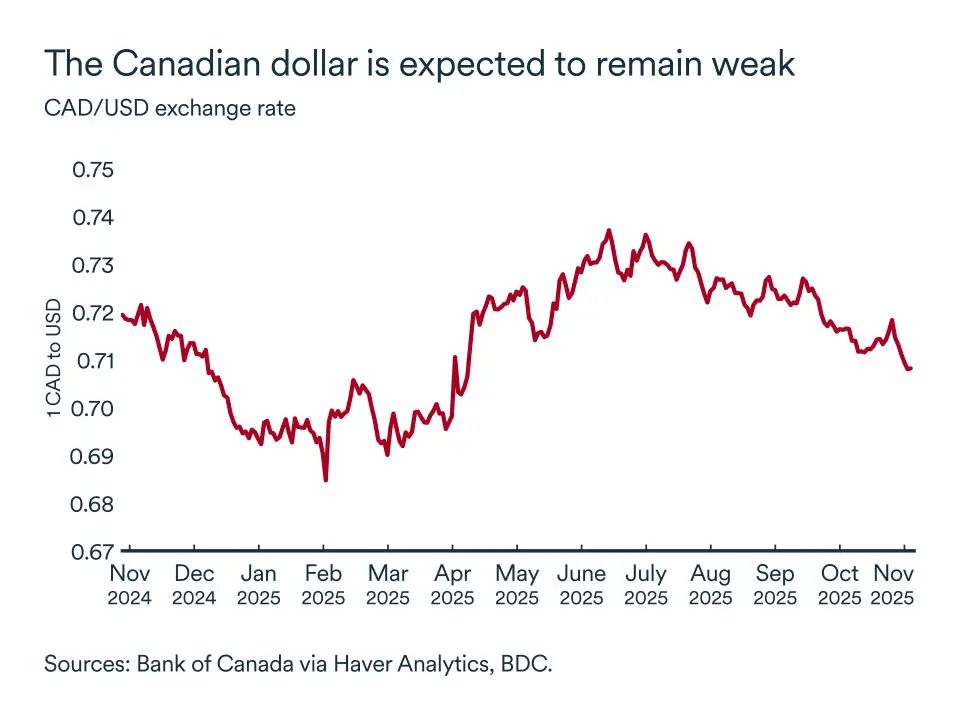
While useful for broad comparisons, nominal GDP per capita has several well-documented limitations that prevent it from being a definitive measure of prosperity or well-being. First, it does not account for differences in the cost of living and inflation rates between countries, which is why PPP adjustments are often preferred for standard-of-living comparisons. Second, the metric says nothing about how income and wealth are distributed within a country. A high figure can mask significant inequality. Third, annual fluctuations in exchange rates can cause a country's ranking to change dramatically from one year to the next, even if the domestic standard of living has not shifted proportionally.
Nominal GDP per capita can be artificially inflated by tax planning activities in certain jurisdictions. This makes the economic data of tax havens unreliable for standard of living comparisons. Furthermore, GDP per capita does not account for social and environmental costs and benefits. Examples include pollution, health outcomes, and unpaid work. These factors are vital components of overall societal welfare. These limitations show why the metric should be used cautiously alongside other indicators.
Related Economic Metrics for Deeper Analysis
To build a more complete picture of a nation's economic health and the financial well-being of its citizens, analysts and institutions use several complementary metrics alongside nominal GDP per capita. These measures help address some of the shortcomings of the basic GDP per capita calculation. Gross National Income per capita measures total income earned by a nation's residents and businesses, regardless of location, offering an alternative to GDP that is less distorted by multinational profit shifting. GDP per capita at Purchasing Power Parity adjusts for cost-of-living differences, providing a better comparison of real living standards across countries.
Median income is the middle point of all personal incomes, which is often more representative of a typical citizen's experience than an average skewed by very high incomes. Disposable income is the amount of money households have available for spending and saving after income taxes have been accounted for. Wealth per adult measures the total net assets per person, providing a snapshot of accumulated financial health rather than annual flow. Examining a combination of these indicators provides a more nuanced and accurate understanding of economic conditions than relying on any single metric alone.
Frequently asked questions
What is the difference between nominal and PPP GDP per capita?
Nominal GDP per capita converts a country's economic output to US dollars using market exchange rates. PPP GDP per capita adjusts for differences in the cost of living between countries. PPP is expressed in international dollars. It is generally considered better for comparing real living standards.
Can GDP per capita be misleading?
Yes, GDP per capita can be misleading. It does not account for income inequality or environmental costs. It can be distorted by exchange rate fluctuations. It can also be inflated by tax avoidance strategies in some countries without proportionally benefiting the local population.
What is Canada's GDP per capita?
According to International Monetary Fund projections for 2026, Canada's nominal GDP per capita is 60,105 current United States dollars. This figure represents the total value of Canada's finished goods and services divided by its population. It is a common proxy indicator for a country's standard of living, though it is an imperfect measure as it does not account for personal income distribution or social and environmental costs. The data places Canada 28th in the global rankings for that year. This ranking can fluctuate from year to year based on exchange rate movements, even if the underlying standard of living does not change significantly.
Is GDP per capita the same as the average salary in Canada?
No, GDP per capita is not a measure of personal income like average salary, median income, or disposable income. It is a macroeconomic metric calculated by dividing a country's total gross domestic product by its population. This measures economic output per person, not how that output is distributed as wages or profits to individuals. For a more accurate picture of personal income, measures such as gross national income per capita or average wage should be consulted. GDP per capita can be distorted by factors like tax planning activities of multinational corporations, further divorcing it from typical individual earnings.
Why do some tiny countries have a higher GDP per capita than Canada?
Several leading jurisdictions in nominal GDP per capita rankings are tax havens, such as Bermuda, the Cayman Islands, Ireland, and Luxembourg. Their economic data can be materially distorted by tax driven corporate accounting entries and financial investments passing through empty corporate shells. This artificial inflation makes their per capita figures very high without a corresponding increase in the actual domestic standard of living for their population. Furthermore, smaller economies often have specialized industries or financial services that concentrate high economic output relative to a small population, leading to high per capita figures that may not reflect broader economic conditions.
How does Canada's GDP per capita rank in the world?
Canada typically ranks in the mid to high twenties globally for nominal GDP per capita. Specific International Monetary Fund projections for 2026 place Canada at 28th. This ranking is above the world average but behind many smaller European nations and other major developed economies. It is important to note that these rankings are based on nominal figures, which use current exchange rates and do not adjust for cost of living differences between countries. Rankings can change annually due to currency fluctuations, and many of the economies above Canada are small jurisdictions, with only a few like the United States also ranking among the world's largest economies by total GDP.
Sources and further reading
- List of countries by GDP (nominal) per capita (Wikipedia) en.wikipedia.org
- GDP per Capita (2026) - IMF worldometers.info
- GDP per Capita by Country 2026 worldpopulationreview.com
- World GDP per capita Ranking 2026 statisticstimes.com
This article explains how things work and is not financial, tax or legal advice. Rules, limits and rates change, so check the current figures with the Canada Revenue Agency, your province or your financial institution before you act.