Gross domestic product (GDP) is the standard measure of a country's total economic output, representing the total monetary value of all final goods and services produced within its borders during a specific period, typically a year. For Canadians, GDP serves as a primary report card on the health and size of the national economy, indicating whether it is growing or shrinking. Statistics Canada publishes detailed GDP figures monthly and quarterly, which policymakers, businesses and investors use to gauge economic performance and inform decisions. Understanding GDP is crucial for interpreting economic trends, from household spending to international trade, that affect jobs, prices and overall prosperity.
What GDP Measures and Its Limitations
Gross domestic product quantifies the total market value of final goods and services produced in a country over a set time. It is designed to measure economic activity and output, providing a snapshot of the size of an economy. GDP focuses solely on final goods and services to avoid double counting the value of intermediate goods used in production. For example, when a car manufacturer buys parts, assembles a vehicle and sells it, only the final car's value is included in GDP, not the parts separately. The measure is widely used for international comparisons and as a broad indicator of national development and economic progress.
However, GDP has significant limitations as a comprehensive measure of well-being. It does not account for income distribution among the population, meaning a country can have high GDP but still experience jobless growth or inequality. GDP also leaves out key externalities such as environmental impact, resource extraction and the value of unpaid domestic work. Alternative indicators like the Human Development Index or Better Life Index attempt to measure human development and well-being more holistically. Critics argue that GDP's focus on market transactions omits many factors that contribute to overall quality of life and sustainable development.
History and Development of GDP
Charles Davenant advanced the method further in 1695. The modern concept of GDP was first developed by American economist Simon Kuznets for a 1934 report to the U.S. Congress, where he notably warned against using it as a measure of welfare. After the Bretton Woods Conference in 1944, GDP became the main tool for measuring a country's economy, initially supplanting gross national product (GNP). The United States officially switched from GNP to GDP in 1991. The role that measurements of GDP played in World War II was crucial to the subsequent political acceptance of GDP values as indicators of national development and progress.
The U.S. Department of Commerce under Milton Gilbert helped embed Kuznets's ideas into official institutions. Over time, the methods for estimating GDP have evolved to keep pace with industrial advances, particularly in valuing the public sector, financial industries and intangible assets. China officially adopted GDP as its indicator of economic performance in 1993, moving away from a Marxist-inspired national accounting system. Today, international standards are set by the System of National Accounts (SNA2008), prepared by organizations including the IMF, OECD, UN and World Bank.
How GDP is Calculated: The Three Approaches
GDP can be determined through three primary approaches, which should theoretically yield the same result: the production approach, the income approach and the expenditure approach. The production approach, also known as the value added approach, sums the outputs of every class of enterprise. It calculates gross value added by subtracting the cost of intermediate materials and services from the gross value of output. This approach aligns with the OECD definition and involves classifying economic activities into sectors to measure output, either by multiplying sector output by market prices or by collecting data on gross sales and inventories from company records.
The income approach estimates GDP by summing all primary incomes distributed by resident producer units, sometimes called gross domestic income (GDI). This includes compensation of employees (wages and salaries), gross operating surplus (corporate profits), gross mixed income (income of unincorporated businesses) and taxes less subsidies on production and imports. In practice, slight discrepancies may occur between income and expenditure measures due to statistical measurement errors reported by national agencies. The income components are defined in systems like the United Nations System of National Accounts and the U.S. National Income and Product Accounts.
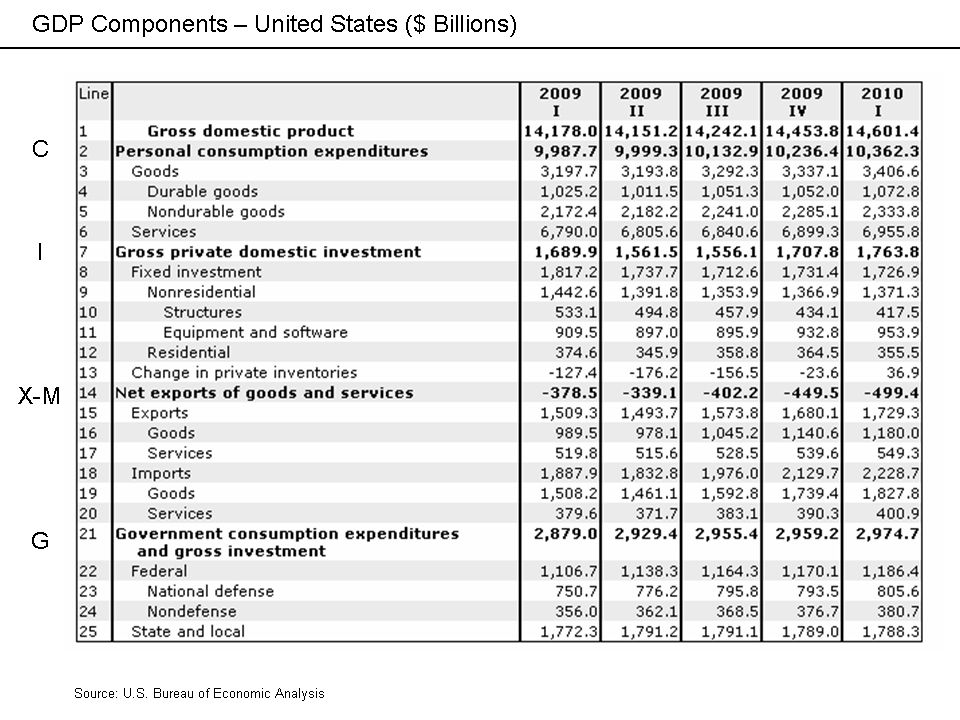
The expenditure approach is the most commonly referenced method, particularly in public discourse. It calculates GDP by adding total final expenditures on goods and services, operating on the principle that all products must be bought by somebody. The formula is expressed as GDP = C + I + G + (X, M), where C is consumption, I is investment, G is government spending and (X, M) is net exports. According to the U.S. Bureau of Economic Analysis, source data for the expenditure components are generally considered more reliable than those for the income components.
Nominal GDP Versus Real GDP
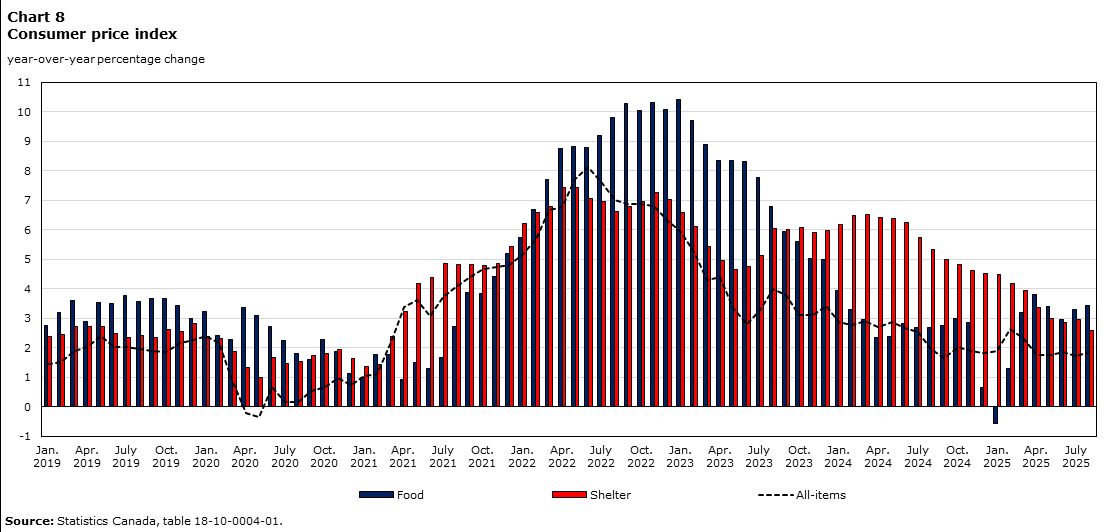
The raw GDP figure is known as nominal GDP, reflecting current market prices during the measurement period without adjustment for inflation. When comparing GDP across different years, nominal GDP can be misleading because changes may be driven by price increases rather than actual growth in output. To make meaningful comparisons over time, economists use real GDP, which adjusts for changes in the value of money. Real GDP is calculated by multiplying nominal GDP by a ratio that reflects the value of money in a base year relative to the measurement year.
For example, if a country's nominal GDP doubled from $100 million to $200 million over a decade but inflation halved the currency's value, the real GDP in the later year would be $100 million in terms of the earlier year's money, indicating no real growth. The factor used for this conversion is called the GDP deflator, which measures changes in the prices of all domestically produced goods and services, including investment goods and government services. Unlike consumer price indices, the GDP deflator covers a broader range of the economy. Real GDP is essential for calculating the GDP growth rate, a key indicator of economic expansion or contraction typically expressed as a percentage change from the previous period.
GDP in the Canadian Economy
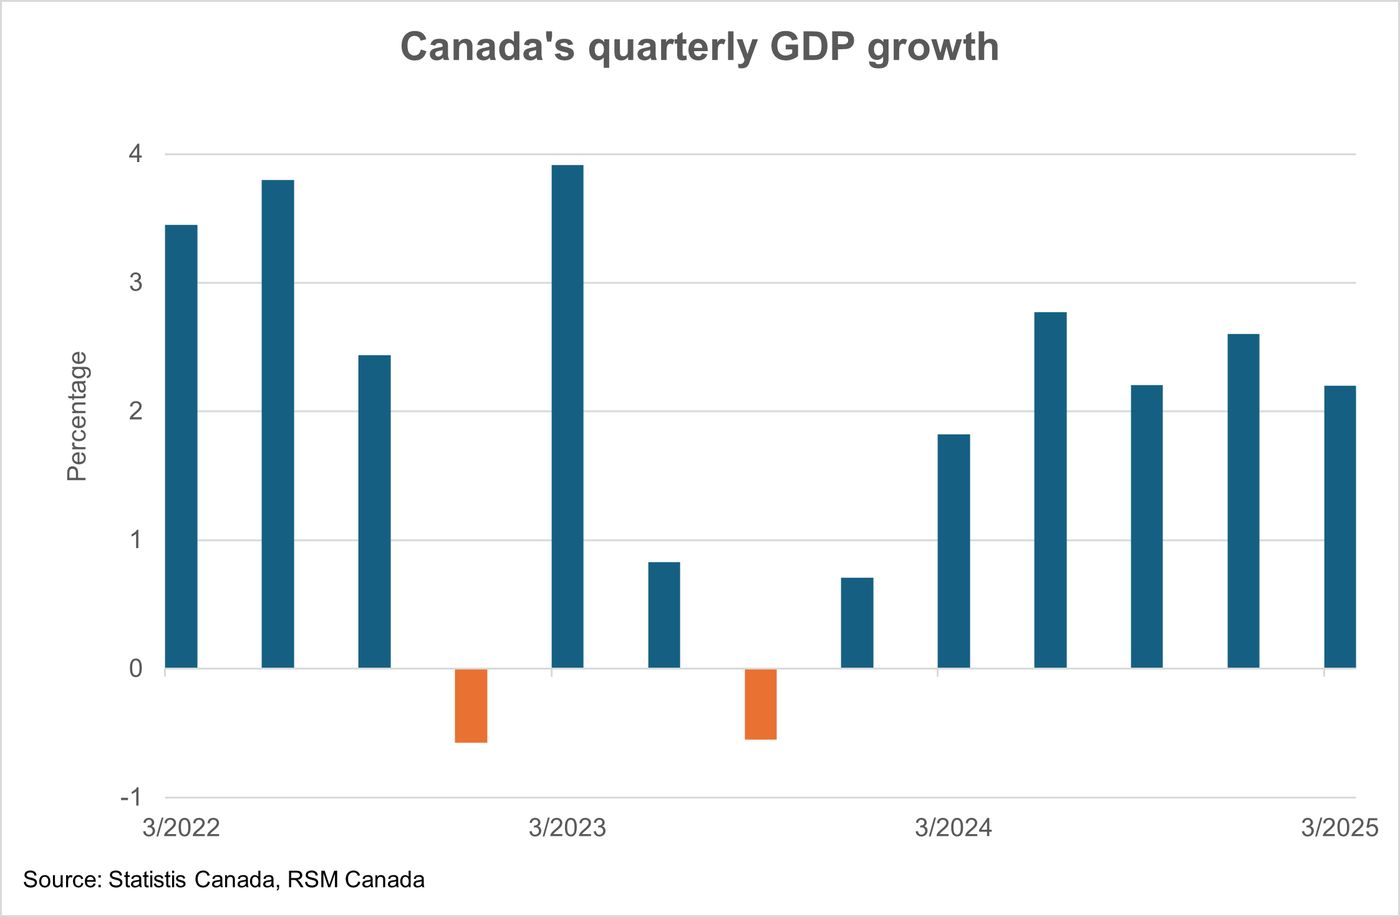
In Canada, Statistics Canada is the national agency responsible for measuring and publishing GDP data, releasing figures monthly and quarterly. The expenditure-based approach is prominently used, breaking down the economy into household spending, business investment, government spending and net exports. Real gross domestic product was unchanged in the first quarter of 2026, following a 0.2% decline in the fourth quarter of 2025. According to World Bank data, Canada's nominal GDP was worth $2,319.90 billion US dollars in 2025, and the country's investment in research and development corresponded to about 1.57% of its gross domestic product in recent years.
Recent Canadian GDP data reveals specific trends across components. Household spending rose 0.4% in the first quarter of 2026, led by higher spending on financial services and food. Business capital investment fell 0.7%, marking the fifth consecutive quarterly decline, though spending on machinery and equipment increased. Government capital investment fell 2.5% in the same quarter, primarily due to lower investment in weapons systems compared to high levels at the end of 2025. Exports edged down 0.1%, impacted by fewer exports of passenger cars and light trucks due to US tariffs, while imports rose 2.9%, significantly influenced by gold imports.
Statistics Canada also provides GDP data by industry and province. Gross domestic product by industry measures the value of output of an industry less the value of intermediate inputs, known as total value-added. In 2024, growth in Canada's Professional, scientific and technical services sector increased by 2.2% over the previous year. Provincial GDP figures are expressed in chained dollars to remove the effect of price changes. Compensation of employees grew in all provinces and territories in the first quarter of 2026, ranging from 0.7% in Quebec to 3.0% in Yukon.
Key Components of Canadian GDP by Expenditure
The expenditure breakdown offers a detailed view of what drives Canada's economic activity. Consumption (C) is normally the largest component, consisting of private household expenditures on durable goods, nondurable goods and services such as food, rent and medical expenses, but not the purchase of new housing. Investment (I) includes business investment in equipment, construction of new facilities, purchase of software and spending by households on new houses, and it does not include exchanges of existing assets or purchases of financial products. Government spending (G) encompasses all government expenditures on final goods and services, including salaries of public servants and military equipment, but it excludes transfer payments such as social security or unemployment benefits.
Net exports (X, M) represent the value of a country's exports minus its imports. Exports are added to GDP because they represent production for other nations' consumption. Imports are subtracted since imported goods are included in the consumption, investment, and government spending components but are produced abroad. The sum of consumption, investment, government spending, and net exports equals the total gross domestic product. This expenditure approach calculates GDP based on the final uses of goods and services in an economy.
| GDP Component | Q1 2026 Change | Notable Drivers |
|---|---|---|
| Household Spending (C) | +0.4% | Higher spending on financial services and food |
| Business Investment (I) | -0.7% | Decline in engineering structures, rise in machinery |
| Government Spending (G) | -2.5% | Lower investment in weapons systems |
| Exports (X) | -0.1% | Fewer car exports due to US tariffs |
| Imports (M) | +2.9% | Surge in gold imports |
Understanding these components helps analysts discern where economic growth originates. For instance, investment includes business spending on equipment and construction, which signals confidence in future production capacity. The GDP deflator measures changes in the prices of all domestically produced goods and services. This differs from consumer price indices, which focus on household goods. Comparing nominal GDP to real GDP, which is adjusted using the deflator, shows whether output growth is real or just due to price increases.
Related Economic Measures and Adjustments
Beyond standard GDP, several related metrics provide additional economic insights. Gross national product (GNP) measures the total value of goods produced by a country's companies and citizens, both domestically and abroad, whereas GDP is confined to geographic borders. Gross national income (GNI) adds net receipts from abroad, such as compensation of employees and property income, to GDP, but GNP and GNI are rarely used as primary health indicators because they do not solely reflect domestic economic activity. GDP per capita divides total GDP by the population, offering a rough gauge of average living standards and economic well-being.
In the first quarter of 2026, real GDP per capita in Canada increased 0.2% as the population declined for a second consecutive quarter while overall GDP remained unchanged. For international comparisons, GDP is often adjusted using purchasing power parity (PPP), which uses a special exchange rate to show what consumers in different countries would pay for the same basket of goods. GDP per capita at PPP is useful for comparing living standards between nations, accounting for cost-of-living differences. These adjustments are crucial for accurate analysis, as nominal GDP growth might appear high during periods of inflation, whereas real GDP reveals the true change in output.
- Nominal GDP: Value in current prices, not adjusted for inflation.
- Real GDP: Inflation-adjusted value, allowing for volume comparisons over time.
- GDP Per Capita: GDP divided by total population.
- GDP (PPP): Adjusted for purchasing power parity for cross-country comparisons.
Economists caution that while a growing GDP is generally positive, it is not a measure of overall standard of living or well-being. GDP does not account for how income is distributed among the population. A country may rank high in GDP but still experience jobless growth. Furthermore, GDP has been criticized for leaving out key externalities, such as environmental impact and unpaid domestic work. Alternative economic indicators, such as the Human Development Index, are sometimes used as better approaches to measuring human development.
Criticisms, Data Issues and Economic Growth
Despite its widespread use, GDP faces ongoing criticism and data quality challenges. A 2022 study published in the Journal of Political Economy found signs of manipulation of economic growth statistics in a majority of countries, particularly in semi-authoritarian or authoritarian states without effective separation of powers. The study compared officially reported GDP growth to the annual growth in the brightness of lights at night measured by satellites, finding that authoritarian states consistently reported higher growth than the night lights data suggested. Corporate havens can also distort GDP figures, as economic activity may be recorded in jurisdictions with favourable tax laws rather than where it actually occurs.
Economic growth, measured by the change in real GDP, is a central focus for policymakers. It reflects the expansion of an economy's capacity to produce goods and services, driven by accumulating human capital, investing in physical capital and adopting new technologies. Sustained growth is the main source of long-term improvements in living standards. However, growth entails costs, including the need to forego some current consumption to invest in future production capacity. Other potential costs, such as resource depletion and environmental degradation, are not reflected in GDP figures, highlighting a significant shortcoming of the measure.
GDP growth is examined as an indicator of short-term economic stability. In Canada, GDP results provide clues about future inflation trends, which the Bank of Canada considers when making monetary policy decisions. While GDP is a vital tool, it is only one of many data sources used to understand the complex economy. Entrepreneurs and businesses monitor GDP to assess the economic health of their country or specific sectors, but they must also consider its limitations and complement it with other indicators for a complete picture.
Frequently asked questions
How is GDP calculated in Canada?
In Canada, Statistics Canada calculates GDP primarily using the expenditure approach, which sums household spending, business investment, government spending and net exports (exports minus imports). The formula is GDP = C + I + G + (X, M). The agency also uses production and income approaches, which should theoretically yield the same result. Data is published monthly and quarterly.
What is the difference between nominal GDP and real GDP?
Nominal GDP is the raw figure based on current market prices without adjustment for inflation. Real GDP is adjusted for changes in the value of money, allowing for meaningful comparisons of economic output over time. The adjustment is made using a factor called the GDP deflator. Real GDP shows whether growth is due to increased production or simply higher prices.
What does GDP not tell us about the economy?
GDP does not account for how income is distributed among the population. It also leaves out key externalities, such as environmental impact and unpaid domestic work. GDP is not a measure of overall standard of living or well-being. A country can have high GDP but still experience inequality or jobless growth.
What does GDP stand for?
GDP stands for gross domestic product. It is a monetary measure of the total market value of all final goods and services produced and rendered during a specific period, typically a year, by a country. This measure is widely used to gauge a nation's economic activity. The modern concept was developed by Simon Kuznets for a 1934 U.S. Congress report. After the 1944 Bretton Woods Conference, GDP became the main tool for measuring a country's economy. It is determined through production, income, or expenditure approaches, which should theoretically yield the same result. GDP serves as a key statistical indicator for international comparisons and national development.
Why is GDP per capita important?
GDP per capita is important because it divides a country's total GDP by its population, providing an idealized rough measure of average economic output per person. This figure allows for more meaningful comparisons of economic performance between nations with different population sizes. For cross country comparisons, GDP per capita figures are often adjusted for differences in the cost of living using purchasing power parity, which can be useful for comparing living standards. However, GDP per capita is not a complete measure of overall standard of living or wellbeing, as it does not account for income distribution, environmental impact, or unpaid domestic work.
Sources and further reading
- Gross domestic product (Wikipedia) en.wikipedia.org
- What is gross domestic product? bankofcanada.ca
- Gross domestic product, income and expenditure, first ... www150.statcan.gc.ca
- What is gross domestic product (GDP)? bdc.ca
- Gross domestic product, Canadian Industry Statistics ised-isde.canada.ca
This article explains how things work and is not financial, tax or legal advice. Rules, limits and rates change, so check the current figures with the Canada Revenue Agency, your province or your financial institution before you act.