Gross domestic product per capita is a key economic indicator that divides a country's total economic output by its population, providing a rough average of economic production per person. In Canada, this measure is crucial for assessing living standards, economic performance, and the nation's relative prosperity compared to international peers. Recent trends show Canada's GDP per capita growth has stagnated relative to other advanced economies, sparking significant debate about the country's economic trajectory. Understanding this metric, its calculation, and its limitations is essential for interpreting Canada's economic health and policy challenges.
What GDP Per Capita Is and How It Is Calculated
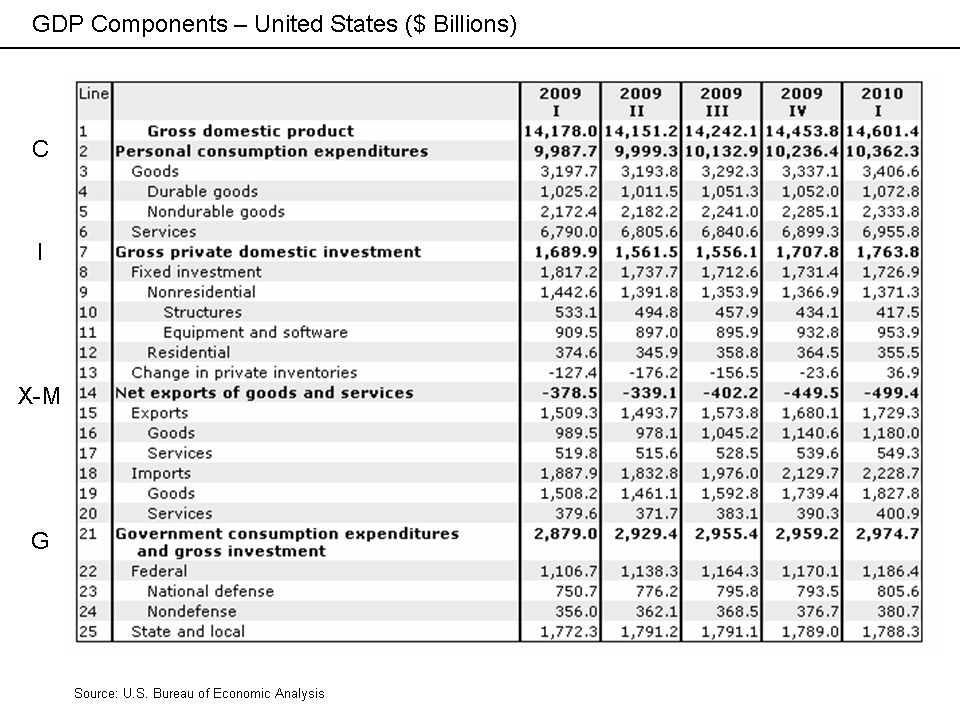
Gross domestic product per capita is derived by taking a country's total gross domestic product and dividing it by its total population. GDP itself is a monetary measure of the total market value of all final goods and services produced within a country's borders during a specific period, usually a year. The calculation of total GDP can be approached through three primary methods which should, in theory, yield the same result. The production or value added approach sums the outputs of every class of enterprise, subtracting the cost of intermediate goods and services used in production. The income approach sums all incomes earned by factors of production, including wages, corporate profits, interest, and rent. The expenditure approach calculates the sum of final purchases in the economy, represented by the formula GDP = Consumption + Investment + Government Spending + (Exports, Imports). Dividing the resulting GDP figure, whether nominal or real, by the midyear population gives the per capita figure, offering an idealized average of economic output per person.
This average is useful for making broad comparisons but comes with important caveats. GDP per capita is a measure of market production, not direct welfare or well-being. It does not account for how income is distributed among the population, meaning a high average can mask significant inequality. Furthermore, it excludes non-market activities such as unpaid domestic work and volunteer services, and it can struggle to capture the value of digital goods and services. Despite these limitations, it remains a foundational metric used by national statistical agencies like Statistics Canada and international organizations such as the Organisation for Economic Co-operation and Development and the International Monetary Fund for cross-country analysis and assessment of economic progress.
The History of GDP and Its Evolution as a Metric
The conceptual foundations of GDP trace back to the 17th century with Sir William Petty, who developed early estimates to calculate tax burdens during Anglo-Dutch wars. Charles Davenant advanced the method further in 1695. The modern concept of GDP was formally developed by economist Simon Kuznets for a 1934 report to the U.S. Congress, where he notably cautioned against using it as a measure of welfare. Following the Bretton Woods Conference in 1944, GDP became the principal tool for measuring national economies, initially alongside gross national product. The United States officially switched from GNP to GDP in 1991, solidifying GDP's role in economic policy and international comparisons.
The methods for estimating GDP have continuously evolved to keep pace with economic changes. Calculating value added in sectors like finance, the public sector, and intangible asset creation is complex, and international conventions are regularly updated. The current global standard is the System of National Accounts 2008 (SNA2008), prepared by major international economic bodies. This framework provides flexible rules for measurement, though challenges remain, including potential manipulation of growth statistics, particularly in authoritarian states. China officially adopted GDP as its key economic indicator in 1993, moving away from a Marxist-inspired national accounting system, highlighting the metric's global acceptance.
The key milestones in the development of GDP as a concept and tool include:
- Sir William Petty developed early concepts of GDP between 1652 and 1674.
- Charles Davenant advanced the method in 1695.
- Simon Kuznets developed the modern concept for a 1934 U.S. Congress report.
- GDP became the main economic measurement tool after the 1944 Bretton Woods Conference.
- The United States switched from GNP to GDP in 1991.
- China officially adopted GDP as its indicator in 1993.
- The current international standard is the System of National Accounts 2008 (SNA2008).
Nominal Versus Real GDP and Purchasing Power Parity
The raw GDP figure based on current market prices is called nominal GDP. Since nominal GDP does not account for inflation, it can be misleading when comparing economic output across different years. To make meaningful comparisons over time, economists calculate real GDP by adjusting nominal figures for price changes using a GDP deflator. For example, if a country's nominal GDP doubled over a decade but inflation halved the currency's value, the real GDP growth would only be 50 percent. Real GDP per capita, which divides this inflation-adjusted output by population, is the preferred measure for assessing changes in living standards and economic well-being within a country over time.
For comparing living standards between different countries, another adjustment is often used: purchasing power parity (PPP). This method adjusts GDP figures for differences in the cost of living, allowing for a more accurate comparison of what a dollar can buy in each nation. GDP per capita at PPP is therefore considered more useful for international welfare comparisons than figures using market exchange rates. These adjustments are critical for contextualizing Canada's economic position relative to peers like the United States and other OECD member countries, as they account for both price levels and population differences.
Canada's GDP Per Capita Performance and Trends
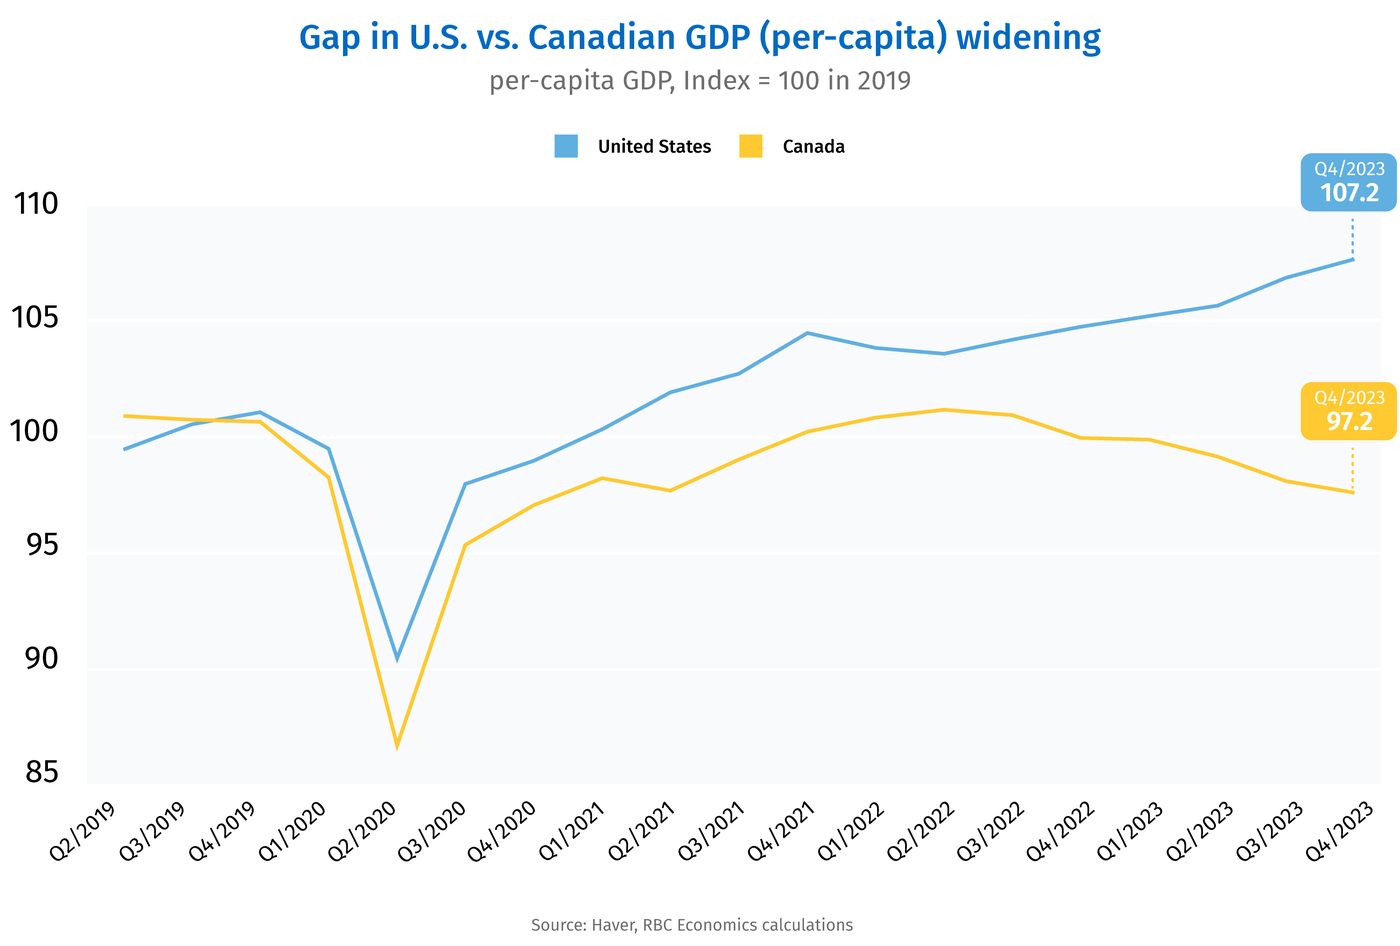
Canada's GDP per capita has shown concerning stagnation in recent years, especially when compared to other advanced economies. From 2014 to 2024, Canada's real GDP per capita adjusted for purchasing power parity grew by just 3.2 percent in total, averaging a mere 0.4 percent per year. This was the third lowest growth rate among 38 advanced nations. In stark contrast, the United States posted 20.2 percent total growth over the same period, while the OECD average reached 15.3 percent. This dramatic divergence marks a shift from the previous decade, where Canada's growth was roughly on par with its peers.
The result is a decline in Canada's relative standing. Canada's real GDP per capita now ranks 19th among 38 OECD countries, down from 17th in 2014. More strikingly, Canada's output per person fell from 83.1 percent of the American level in 2014 to just 71.4 percent in 2024. Furthermore, Canada historically exceeded the OECD average but dropped to 99.5 percent of it in 2024, falling below the average for the first time in recorded history. In nominal terms, Canada's GDP per capita stands at approximately $52,000, though provincial figures vary significantly, with Alberta recording $71,545 in recent data.
Key data points illustrating Canada's GDP per capita trends include:
- Total growth from 2014 to 2024 was 3.2 percent (0.4% annually).
- Rank among OECD countries fell from 17th in 2014 to 19th in 2024.
- Ratio to U.S. GDP per capita fell from 83.1% in 2014 to 71.4% in 2024.
- Ratio to OECD average fell to 99.5% in 2024, below average for the first time.
- Nominal GDP per capita is approximately $52,000.
- Alberta's GDP per capita was $71,545 in recent data.
Why Per Capita Measures Matter for Understanding Canada's Economy
Analysts emphasize that per capita economic measures often provide a clearer picture of national economic health than headline GDP figures, especially in a country like Canada experiencing sharp swings in population growth. When population grows rapidly, total GDP can appear strong even if output per person is declining. Conversely, when population growth slows, headline GDP can contract even while the per-person economy is resilient. This was evident in recent quarters where Canada saw consecutive contractions in total GDP that coincided with rare population declines, masking underlying per-person growth. Per capita measures better reflect how households and workers experience the economy, including their income potential and standard of living.
Industry-level data on a per capita basis also reveals important trends. In 2026, services sector output per person remained robust, supported by household spending, while goods-producing sectors like manufacturing showed softness. Employment and unemployment rates, which are per-worker measures, have stabilized, contrasting with headline job figures distorted by population changes. A diffusion index calculated using per-capita industry GDP showed a sharp deterioration in 2023 similar to past recessions, followed by recovery, indicating that rapid population increase had previously masked weaker broad-based activity per person. This analysis underscores that per capita metrics are vital for identifying structural economic challenges beyond the noise of demographic shifts.
Limitations, Criticisms, and Complementary Indicators
GDP per capita is widely criticized for its significant limitations as a measure of overall well-being. It is strictly a measure of market output and does not account for income distribution, meaning a high average can coexist with widespread poverty or inequality. The metric excludes non-market activities like household production and volunteer work, and it fails to capture environmental degradation or resource depletion. It also struggles to value digital goods and quality improvements in services. Because it is an average, it can be skewed by extreme incomes at the top, making median household income a useful complementary measure, though one also affected by government transfers.
In response to these shortcomings, alternative and complementary indicators have gained prominence. These include the United Nations' Human Development Index, which combines health, education, and income metrics, and the OECD's Better Life Index. Canada's own Quality of Life Hub is in development by Statistics Canada to provide a broader dashboard of well-being measures. Empirical evidence, however, shows that GDP per capita still correlates strongly with many social outcomes. Cross-country analysis reveals positive correlations between higher GDP per capita and higher life expectancy, lower infant mortality, lower inequality, and greater self-reported life satisfaction, suggesting that economic productivity remains a foundational component of societal well-being despite the metric's flaws.
The primary limitations and criticisms of GDP per capita include:
- Does not account for income distribution or inequality.
- Excludes non-market activities like unpaid domestic work.
- Fails to capture environmental degradation or resource depletion.
- Struggles to value digital goods and quality improvements in services.
- Is an average that can be skewed by very high incomes.
- Does not directly measure happiness, health, or leisure time.
The Broader Debate on Canada's Economic Trajectory
The stagnation of Canada's GDP per capita has ignited a serious debate about the nation's economic direction and policy. Critics argue that the decline relative to peers signals deep structural problems, not mere measurement issues. This concern is amplified by Canada's parallel slippage in other international rankings. The country's position on the UN Human Development Index fell from 13th in 2013 to 16th in 2023. More strikingly, Canada's ranking in the World Happiness Report dropped from 5th in 2012 to 25th in 2026, with young Canadians under 25 ranking as low as 71st globally in happiness, a trend linked in part to housing affordability crises.
Key structural challenges underpinning the weak per capita performance include persistently weak business investment, a multi-year slowdown in real estate, and rising living costs. External risks such as U.S.-Canadian trade tensions and global conflicts also cloud the outlook. The debate centers on whether Canada is experiencing a temporary soft patch or a more entrenched decline in productivity and competitiveness. While per capita measures show early signs of recovery from a 2023 soft patch, the long-term trend of falling behind the United States and the OECD average suggests that reversing the decline will require addressing fundamental issues in investment, innovation, and policy to restore robust growth in output per person.
Evidence of Canada's declining relative performance across broader well-being metrics includes:
- UN Human Development Index rank fell from 13th in 2013 to 16th in 2023.
- World Happiness Report rank fell from 5th in 2012 to 25th in 2026.
- Young Canadians under 25 rank 71st globally in happiness.
- Persistent weak business investment.
- Multi-year real estate slowdown.
- Rising living costs, particularly for lower-income Canadians.
Frequently asked questions
What are the main limitations of GDP per capita?
GDP per capita has several key limitations. It measures only market production, ignoring non-market activities like unpaid domestic work. It does not account for income inequality, environmental degradation, or resource depletion. The metric is an average that can be skewed by very high incomes, and it does not directly measure well-being, happiness, health, or leisure time.
What is GDP per capita?
GDP per capita is an idealized rough measure calculated by dividing a country's total gross domestic product by its population. It is often used as a broad metric for international comparisons and as a statistical indicator of national development and progress. However, it is not a measure of overall standard of living or well being, as it does not account for how income is distributed among the population. GDP per capita at purchasing power parity can be more useful for comparing living standards between nations as it adjusts for differences in the cost of living. The measure serves as an average estimate of economic output per person.
How is Canada's GDP per capita performing?
Canada's GDP per capita performance shows concerning trends. According to recent data, Canada's GDP per capita stands at approximately $52,000. Statistics indicate that Canada's GDP per capita, after adjusting for inflation, exceeded the OECD average by US$3,141 in 2002 but is projected to fall below the average by US$8,617 in 2060. Recent figures show consecutive contractions in gross domestic product per capita, with Alberta recording a specific GDP per capita of $71,545. The overall measure averaged $32,570.14 USD from 1960 until 2025, reaching an all time high of $45,883.01 USD in 2022.
Why do economists look at per capita GDP instead of just total GDP?
Economists look at per capita GDP because it accounts for population size, providing a more accurate sense of economic performance for the average person. Total GDP is a monetary measure of the total market value of all final goods and services produced, but it does not reflect distribution. Dividing total GDP by the population gives a rough measure that is useful for cross country comparisons of economic activity. This is crucial as population growth, such as through mass immigration, can raise consumption and demand, thereby contributing to total GDP growth without necessarily improving individual living standards. Per capita figures help avoid such misleading interpretations.
What is the difference between nominal and real GDP per capita?
The difference lies in the adjustment for inflation. Nominal GDP per capita uses current market prices and current exchange rates, making it useful for comparing national economies on the international market. Real GDP per capita adjusts the nominal figure for changes in the value of money over time using a GDP deflator, which measures price changes for all domestically produced goods and services. This adjustment allows for meaningful comparisons of economic output and living standards from one year to another. Real GDP per capita is the standard measure for assessing true economic growth within a country, as it isolates changes in production volume from price fluctuations.
How does Canada's GDP per capita compare province to province?
GDP per capita varies significantly across Canadian provinces due to differences in industries and economic structures. For example, Alberta recorded a GDP per capita of $71,545 according to recent data, which is substantially higher than the national average. The national average itself is derived from Statistics Canada data, which shows gross domestic product per capita figures that are averaged by year. These provincial disparities highlight that the national figure is an aggregate that masks regional economic differences. The variation is a result of the contribution of different industries or sectors within each provincial economy to the total GDP.
Sources and further reading
- Gross domestic product per capita (Wikipedia) en.wikipedia.org
- Why Canada's GDP per capita crisis is real: DeepDive thehub.ca
- Gross domestic product (GDP) per capita statcan.gc.ca
- Canada's per-capita economy still recovering, RBC Economics rbc.com
This article explains how things work and is not financial, tax or legal advice. Rules, limits and rates change, so check the current figures with the Canada Revenue Agency, your province or your financial institution before you act.