A stock market bubble is a period when market participants drive share prices far above their fundamental value in relation to rational valuation systems. These episodes are characterized by widespread speculation, herd behavior, and a collective belief that old valuation rules no longer apply, often followed by a sharp and painful crash. Recent market dynamics, including high-flying individual stocks and concerns around concentrated sectors like artificial intelligence, make the study of bubbles particularly relevant for portfolio management and risk assessment.
Definition and Core Mechanisms
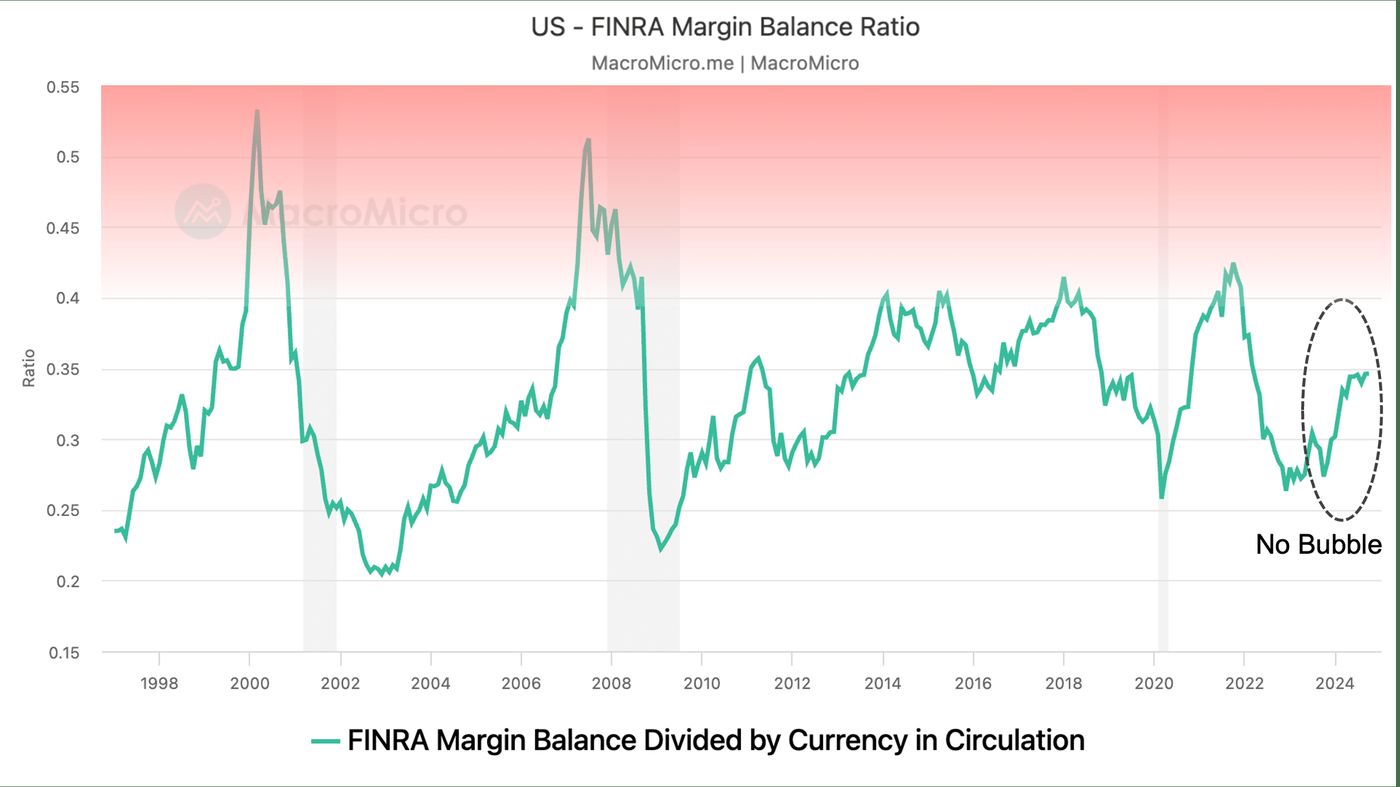
A stock market bubble is defined as a type of economic bubble occurring when market participants collectively drive stock prices significantly above their intrinsic value. This divergence is measured against established systems of stock valuation, such as price-to-earnings ratios or net asset values. The phenomenon relies on a self-reinforcing cycle known as positive feedback, where rising prices attract new investors who are drawn by the momentum itself rather than fundamental analysis. This additional investment pushes prices higher still, creating a loop of increasing disequilibrium. Unlike normal market volatility, which is tempered by negative feedback where higher prices encourage selling, a bubble enters a state where the usual stabilizing mechanisms fail. Ultimately, this process leads to a rapid price spike far beyond rational economic value, which is inevitably followed by a precipitous decline. Financial markets operate in an ever-changing equilibrium, but once positive feedback takes over, the market enters a state of increasing disequilibrium that can only end with a correction.
Theoretical Explanations and Debates
The causes of stock market bubbles are a central debate in finance, primarily between behavioral finance theorists and proponents of market efficiency. Behavioral finance attributes bubbles to pervasive cognitive biases that lead to groupthink and herd behavior, where investors irrationally follow the crowd. Pundits and participants often create new rationales, such as citing a new economy, to justify overvalued markets and dismiss traditional valuation metrics. In contrast, some analysts argue for the wisdom of crowds, suggesting that price movements reflect rational expectations of future fundamental returns. Large traders with significant market power can also generate bubbles by moving prices. To test these competing claims, researchers study instances where a clear measure of fundamental value is observable alongside market prices, such as in closed-end funds or experimental markets.
Closed-end country funds in the late 1980s provide a clear case study where stock prices clearly diverged from fundamental values. Observers could directly compare a fund's stock price to its net asset value per share, which is the net value of its holdings divided by shares outstanding. During this period, funds like the Spain Fund traded at massive premiums, reaching nearly triple its net asset value of about twelve dollars per share at a peak price near thirty-five dollars. Similarly, experiments in controlled asset markets, where expected returns are predetermined and communicated to traders, consistently show prices diverging from fundamental values. These observable divergences challenge the efficient-market hypothesis, which posits such mispricing should not occur. The rapid creation and sale of new country fund IPOs at high premiums during the bubble further illustrates how supply expands to meet speculative demand until the pool of new buyers, often called greater fools, is exhausted, which took only a few months for premiums to fade back to typical discounts.
Historical Examples of Major Bubbles
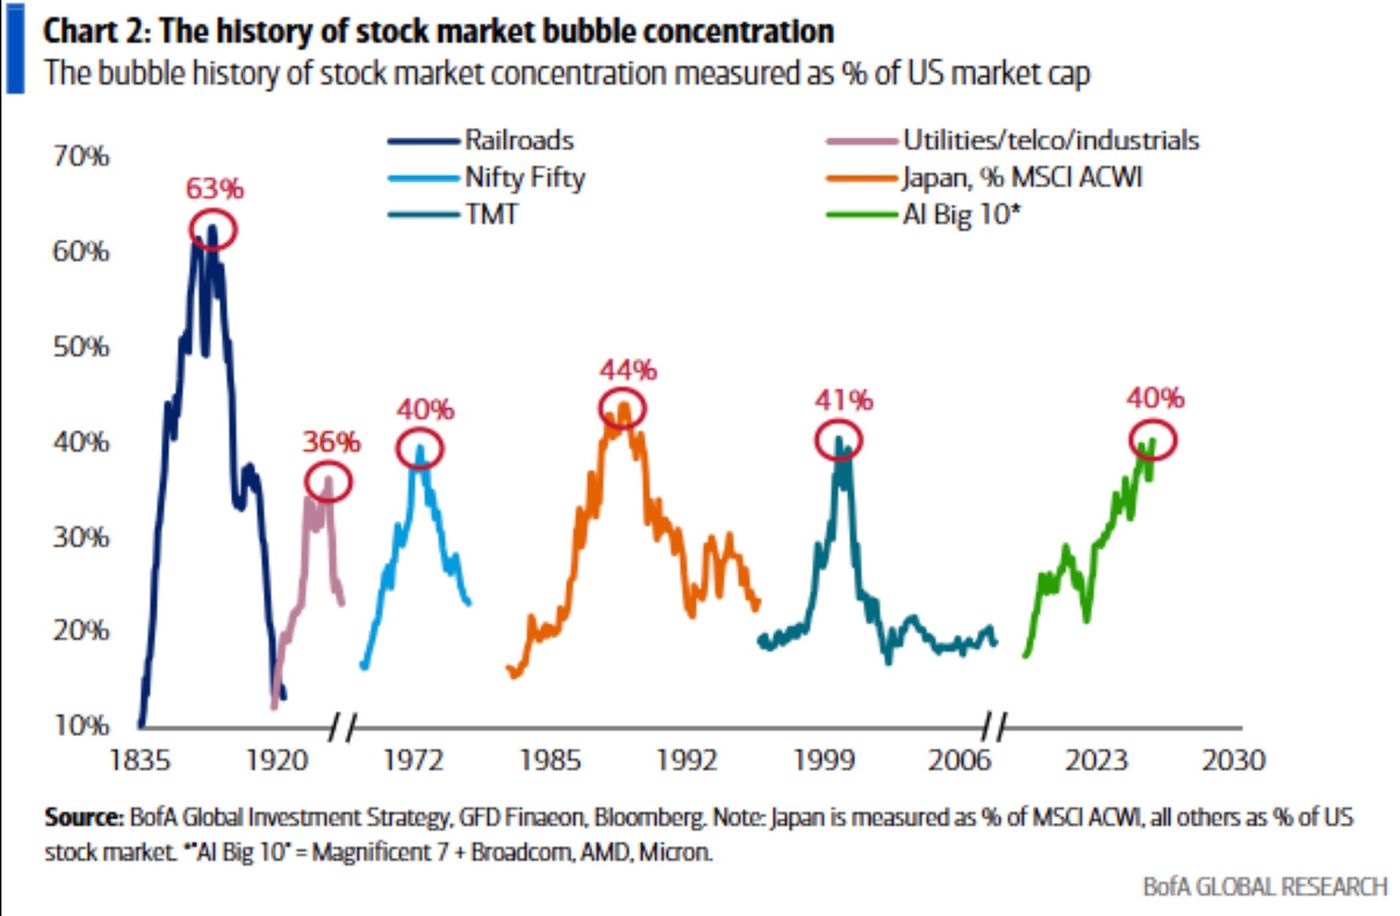
The history of stock market bubbles stretches back centuries, with their modern roots in the financial activities of the 17th-century Dutch Republic, home to the first formal stock exchange. The Dutch tulip mania of the 1630s is widely considered the world's first recorded speculative bubble. The 20th century featured two major bubbles driven by technological innovation. The 1920s American stock bubble, preceding the 1929 crash and the Great Depression, was fueled by new technologies like radio, automobiles, aviation and electrical power grids. The Dot-com bubble of the late 1990s was based on speculative frenzy around emerging internet and e-commerce companies, many of which had minimal sales or earnings profiles.
Other significant global bubbles include the Encilhamento in Brazil during the late 1880s and early 1890s, the Go-Go markets of the late 1960s, the Nifty Fifty stocks of the early 1970s, the Taiwanese stock bubble of 1987 to 1989, and the Japanese asset price bubble of the late 1980s. A common feature across many bubbles is the emergence of a hot market for initial public offerings where investment bankers and their clients see opportunities to float new stock issues at inflated prices. This activity misallocates investment funds to areas dictated by speculative trends rather than to enterprises generating long-standing economic value. Typically, when there is an overabundance of IPOs in a bubble market, a large portion of the IPO companies fail to achieve what is promised to the investors, or can even be vehicles for fraud, leading to significant investor losses when the bubble bursts.
Bubbles and Market Dynamics in Canada
The Canadian stock market has experienced its own periods of turbulence and speculative excess that align with the classic patterns of a bubble. The S&P/TSX Composite Index has undergone several bear markets with declines of more than 20 percent, which are often the aftermath of inflated valuations. Historical examples include a 29 percent drop from May 1969 to May 1970 during the Vietnam War era and a 37 percent decline from October 1973 to December 1974 following the Oil Embargo. More recently, analysts have pointed to overheated conditions and a disconnect in some market segments, with individual stocks seeing extreme rallies. For instance, Tesla shares rose about 1,160 percent over one year while Ottawa's Shopify Inc. rose 425 percent, becoming a focal point for concerns about market froth.
Canadian investors also contend with market concentration risks that can amplify bubble effects. The domestic equity market has a high concentration in financials and energy sectors, which can lead to correlated downturns. Furthermore, Canada's stock market has been shrinking, with the number of publicly listed companies down 32.7 percent and initial public offerings down 94 percent since 2010. This decline in market breadth and new listings can affect liquidity and may influence speculative dynamics by reducing the diversity of available investments. The deflating housing bubble in Canada has also demonstrated a wealth effect, where falling home prices reduce consumer spending and hurt sentiment, showing how asset bubbles in one sector can impact the broader economy and stock market behavior. Stock market gains in such an environment mainly benefit the wealthiest Canadians, which can skew overall market participation and risk.
Identifying Bubbles Versus Market Cycles and Balloons
Distinguishing a genuine bubble from a normal market cycle is a critical challenge for investors, and some argue the term bubble itself is overused. A true bubble is marked by unsustainable price increases utterly disconnected from underlying fundamentals, where the investment premise itself collapses. Think of a bubble as an investment where prospective returns do not improve meaningfully after a price fall because the underlying investment premise has collapsed. This was evident during the dot-com bubble. Despite some stocks falling by 90 percent, future returns did not increase enough to produce a recovery. In contrast, a market cycle represents natural fluctuations of expansion and contraction driven by fundamental economic factors. Excesses in a cycle will correct and recover over time, whereas a bubble burst leads to widespread, often irreversible losses.
Some analysts suggest that a balloon might be a more accurate analogy than a bubble. A bubble implies a fragile equilibrium where any minor external factor can cause a sudden, irreparable pop. A balloon, however, acknowledges that markets can become overinflated but also have the capacity to deflate gradually and stabilize, representing a dynamic system that can handle a degree of exuberance. This analogy underscores the difficulty of identifying the precise breaking point, as no one knows how much air the balloon can hold before the tiny additional amount stretches the system to its breaking point. Symptoms used to diagnose bubbles, such as widespread new era thinking, high public excitement, and soaring media coverage, are not foolproof indicators. Markets can exhibit these symptoms and continue rising for years, as was the case when warnings were issued in 1996 before the market doubled over the subsequent few years, illustrating that the presence of bubble conditions does not predict the timing of a crash.
Structural Incentives and Professional Investor Behavior
Several structural incentives within financial markets can propagate and prolong stock market bubbles, increasing risks for all investors. Investment managers, such as stock mutual fund managers, are compensated and retained in part due to their performance relative to peers. Taking a conservative or contrarian position as a bubble builds results in performance unfavorable to peers, which may cause customers to go elsewhere and can affect the manager's own employment or compensation. The typical short-term focus of equity markets exacerbates the risk for investment managers that do not participate during the building phase of a bubble, particularly one that builds over a longer period. In attempting to maximize returns for clients and maintain their employment, they may rationally participate in a bubble they believe to be forming, as the benefits of participation outweigh the risks of not doing so in the short term.
This professional herd behavior contributes to the positive feedback loop, as large amounts of capital flow into overvalued assets. The effect of these incentives means that even managers who privately suspect a bubble may feel compelled to buy in, fearing career risk more than market risk. This dynamic helps explain why bubbles can inflate for very long periods, as noted in commentary for do-it-yourself investors, with incredible riches spun off in the process. The phenomenon is not new and is recounted in historical accounts of manias, where the pressure to conform and profit in the moment overrides caution. This institutional framework is a key reason why bubbles are a recurrent feature of financial markets, despite widespread knowledge of their eventual outcomes.
Strategies and Considerations for Canadian Investors
For do-it-yourself investors, the primary dilemma is how to reap the rewards of a booming market without risking significant capital when a potential bubble bursts. Bubbles can inflate for a very long time and spin off incredible riches in the process, making market timing exceptionally difficult and often counterproductive. A key strategy is to implement guards against a stock market bubble through diversification, not just across asset classes but also geographically. Geographic diversification has re-emerged as a particularly effective tool, as the correlation between the TSX and international markets has dropped significantly after a period of high synchronization. The two-year average correlation of the TSX to international markets fell below 60 percent in 2024 for the first time since 2018, indicating much more dispersion across different markets and a return of geographic diversification's effectiveness after years of lockstep movement.
This dispersion provides a natural hedge, especially against sector-specific manias like the current focus on artificial intelligence. Non-U.S. markets offer a significant hedge against AI concentration. By one asset manager's calculations, nearly half of the U.S. stock market's value is pegged to AI companies, while for the rest of the world, it is closer to 10 percent. However, selectivity is still required, as South Korean and Taiwanese stocks, for example, are heavily exposed to AI through their large microchip manufacturers. The valuation gap against the U.S. has narrowed but remains compelling for non-U.S. equities, particularly in Asia where stocks have taken the lead in performance in recent periods. Investors must also be cautious of novel, speculative products that increase risk, such as the growth in Canadian single-stock ETFs and proposed sports-team ETFs that blur the line between investing and gambling.
- Use geographic diversification with assets in U.S., European, and Asian markets to reduce correlation risk.
- Be aware of sector concentrations, both in a Canadian portfolio heavy in financials and energy and in global tech holdings.
- Understand that tools like single-stock ETFs and novel products like proposed hockey team ETFs introduce new speculative risks and blur lines with gambling.
- Maintain a long-term perspective, recognizing that calling a bubble's peak is notoriously difficult, as exemplified by forecasters who have issued repeated false alarms in recent years.
- Consider that cash and bonds have their own risks in such environments, as bonds can lose value when yields spike and cash offers minimal returns.
- Acknowledge that true market bubbles are less common than financial news suggests, and many high-priced markets may correct as part of a normal cycle rather than crash permanently.
The goal for investors is to stay in the game without losing your shirt. This requires a balanced approach that accepts some exposure to growth while mitigating the risk of catastrophic loss from a bursting bubble. It involves continuous assessment of valuation gaps and market correlations. For Canadian portfolios, thoughtful geographic and sector allocation can be a practical defence. This is especially relevant as traditional hedges like bonds and gold have faced recent challenges.
Frequently asked questions
What is a stock market bubble?
A stock market bubble occurs when investors collectively drive share prices far above their fundamental or intrinsic value. This is fueled by speculation, herd behavior, and a belief that traditional valuation metrics no longer apply. The bubble inflates through a positive feedback loop where rising prices attract more buyers, which pushes prices even higher until the unsustainable peak collapses, often leading to a sharp market crash. Emotional and cognitive biases are seen as primary causes, though some argue bubbles can have rational or contagious elements.
What are some famous historical examples of stock market bubbles?
Famous historical examples include the Dutch tulip mania of the 1630s. Two famous early stock market bubbles were the Mississippi Scheme in France and the South Sea bubble in England, both ending in 1720. The two most famous bubbles of the twentieth century were the American stock bubble of the 1920s before the 1929 crash and the Dot-com bubble of the late 1990s. Other notable stock market bubbles include the Encilhamento in Brazil during the late 1880s, the Nifty Fifty stocks in the early 1970s, Taiwanese stocks in 1987 to 1989, and Japanese stocks in the late 1980s.
Has the Canadian stock market experienced bubbles?
Yes, the Canadian market has experienced periods of significant decline often associated with the bursting of inflated valuations. The S&P/TSX Composite Index fell 37 percent during the 1973 to 1974 Oil Embargo bear market and 29 percent from 1969 to 1970 during the Vietnam War era. More recently, extreme rallies in individual stocks like Shopify and sector concentrations have led analysts to warn of overheated, bubble-like conditions in certain segments. Canada's shrinking number of public companies and low IPO activity since 2010 also change the market's speculative dynamics.
How can I protect my investments from a stock market bubble?
Protecting investments involves diversification across asset classes and geographies. Geographic diversification is particularly effective when correlations between markets are low, as seen recently between the TSX and international indices. Avoiding concentration in highly speculated sectors like AI, maintaining a long-term perspective, and not attempting to time the market are key strategies. Investors should also be wary of new, complex products like single-stock ETFs that can increase risk. An easy way to guard against a bubble is to ensure your portfolio is not overly reliant on any one narrative or region.
What is the difference between a bubble and a normal market cycle?
A normal market cycle involves periodic expansions and contractions driven by economic fundamentals like earnings and interest rates, with prices eventually recovering. A bubble is characterized by a price explosion completely detached from fundamentals, where the core investment premise fails and does not recover. When a bubble bursts, it often causes permanent capital loss, as prospective returns do not improve even after large price falls. A cycle downturn is typically followed by a recovery as fundamentals reassert themselves, whereas a bubble collapse leaves a lasting devaluation.
Are we in a stock market bubble today?
While certain market segments, such as some technology and AI-related stocks, show signs of exuberance and high valuations, many analysts argue the term bubble is overused. Market conditions may resemble an overinflated balloon more than a fragile bubble, meaning the system can handle some excess without an imminent crash. The presence of bubble symptoms does not guarantee an immediate burst, as markets can remain high for extended periods, evidenced by warnings in 1996 that preceded years of further gains. Current dispersion across global markets and geographic diversification opportunities also suggest conditions differ from a unified, system-wide bubble.
Sources and further reading
- Stock market bubble (Wikipedia) en.wikipedia.org
- Market Factors: An easy way to guard against a stock ... theglobeandmail.com
- Bursting The Myth: Understanding Market Bubbles russellinvestments.com
This article explains how things work and is not financial, tax or legal advice. Rules, limits and rates change, so check the current figures with the Canada Revenue Agency, your province or your financial institution before you act.