The Management Expense Ratio (MER) is the total annual cost of owning a mutual fund or exchange-traded fund (ETF) in Canada, expressed as a percentage of the fund's average assets. It combines management fees, operating expenses, and applicable taxes into a single figure. The MER is deducted directly from the fund's assets, reducing the net return received by investors. For Canadians, understanding the MER is crucial as it directly impacts long-term investment growth and is a key component of fee transparency under Canadian securities regulations.
What the Management Expense Ratio Is and How It Works
The Management Expense Ratio represents the combined annual costs of managing an investment fund, including all operating expenses and taxes. It is expressed as a percentage of the fund's total average assets under management. For example, a fund with a 2.5% MER and $10,000 in assets would incur about $250 in fees annually. This fee is not paid directly by the investor but is deducted from the fund's assets before investment performance is calculated, which means it is reflected in the net return an investor ultimately receives. The MER is calculated twice per year, with the figure being an annualized percentage based on the fund's average daily net asset value over the reporting period.
This calculation includes the fund's proportionate share of the MER of any underlying fund or ETF in which it has invested. The components that make up the MER are detailed in regulatory documents but are aggregated into this single percentage for investor clarity. The purpose of the MER is to cover the ongoing costs of professional investment management, fund supervision, and operational administration. By bundling these costs, the MER provides a standardized way to compare the cost efficiency of different investment funds available to Canadian investors.
The MER is a critical metric for analyzing the cost of fund ownership because it directly reduces an investor's returns. An expense ratio of 1% per annum means that each year 1% of the fund's total assets will be used to cover its expenses. Over long periods, even a seemingly small difference in MER can significantly affect the overall growth of an investment portfolio. The MER does not include sales commissions or performance fees, which are separate charges that may also apply depending on the fund and how it is purchased.
Detailed Breakdown of MER Components
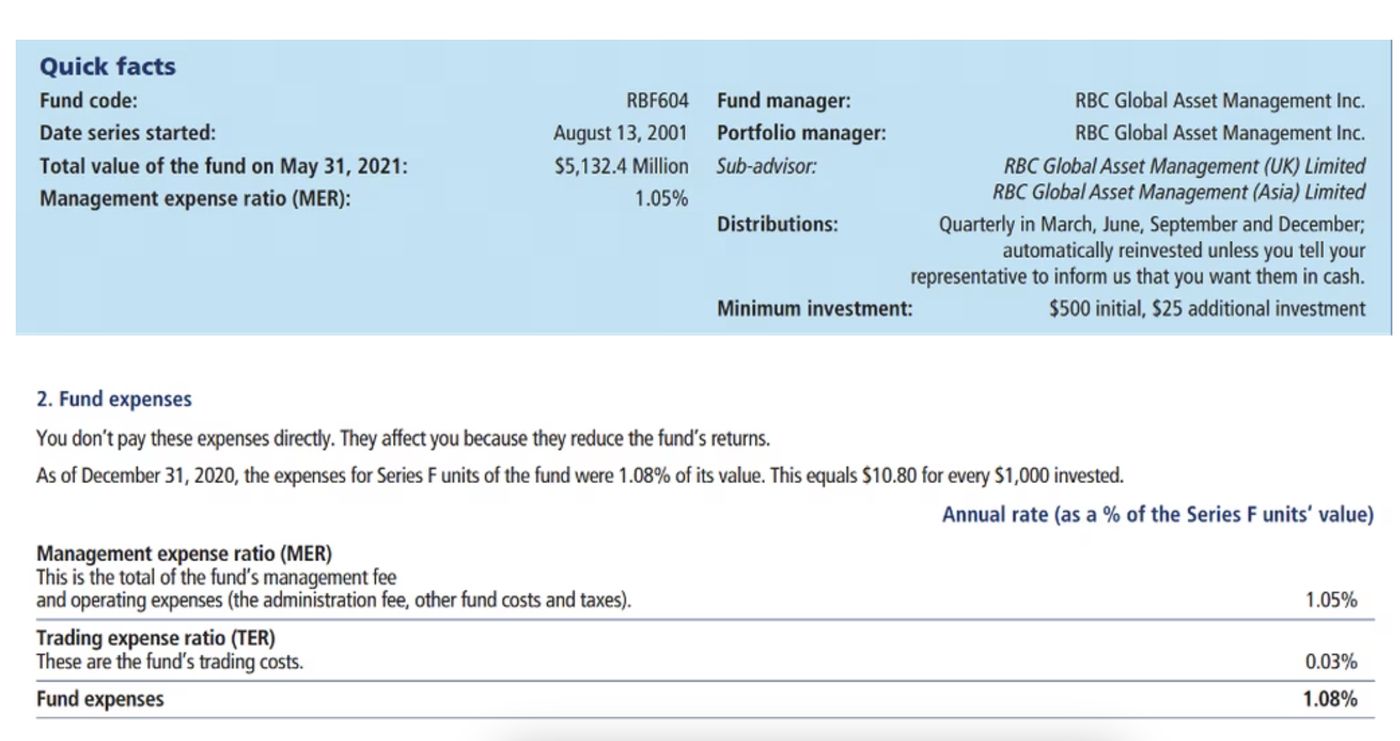
The MER is composed of several distinct cost categories, though their specific breakdown can vary between different series of the same fund. The primary component is the management fee, which is paid to the investment management firm for professional portfolio management and research. This fee covers the expertise of portfolio managers and their teams, access to research reports, market data, and proprietary analysis tools. Another major component is the trailing commission, which is compensation paid to the investment dealer and the financial advisor for providing ongoing advice and service to the investor. This is included in Series A funds but not in Series F funds.
Operating expenses form another critical part of the MER, covering the day-to-day costs of running the fund. These expenses include legal and audit fees, record keeping, custodian fees, regulatory filing costs, and the technology and infrastructure needed to service investor accounts. Finally, the MER includes all applicable taxes, such as the Goods and Services Tax (GST) and Harmonized Sales Tax (HST), on the management and administration fees. It is important to note that the MER does not include trading commissions or performance fees, which are accounted for separately.
- Management Fee: Payment for professional investment management, fund supervision, and research from portfolio managers and analysts.
- Trailing Commission: Advisor and dealer compensation for ongoing advice, access, and service (included in Series A MERs).
- Operating Expenses: Legal, audit, record keeping, custodian fees, regulatory costs, and systems infrastructure.
- Taxes: GST and HST applied to management and administration fees.
- Administration: Costs for client statements, trade confirmations, and account management services.
The value provided by these fees includes professional management that frees investors from daily research, oversight of investments, and access to specialized tools and market data. For Series F funds, the MER consists only of management fees, operating expenses, and taxes, with advice fees charged separately. For Series A funds, the MER is a bundled price that covers all these elements plus the trailing commission, resulting in a higher stated percentage. The management fee within the MER pays for oversight of your investments, allowing active mutual fund managers and analysts to dedicate their professional lives to researching and analyzing current and potential holdings for the mutual fund.
How MERs Differ Between Fund Series, Types, and Structures
The structure and total level of an MER differ significantly between fund series, which are designed for different types of investor-advisor relationships. Series A mutual funds represent a bundled approach where the MER covers everything, including the trailing commission paid to the advisor and dealer. This results in a higher overall MER. In contrast, Series F mutual funds are available in fee-based accounts and have an MER that consists only of management fees, operating expenses, and taxes. Fees for advice and service are charged separately by the advisor's firm, leading to a lower published MER.
The MER also varies greatly depending on the fund's investment strategy and asset class. Index funds and ETFs that passively track a market benchmark generally have very low MERs, often below 0.5%, because their management requires less active research and trading. Actively managed funds, which aim to outperform an index, have higher MERs due to the costs of specialized portfolio managers and research teams. Sector-specific funds, emerging markets funds, and other complex or specialized strategies typically carry the highest MERs, reflecting the increased research and management intensity required.
Funds accessed through group savings plans, like workplace retirement plans, often have lower MERs compared to the same funds held in individual accounts. This is due to the economies of scale and negotiated fee arrangements available to large group plans. Furthermore, the MER for a fund that invests in other funds will include its proportionate share of the underlying funds' MERs. This layered cost structure is important for investors to understand when evaluating funds of funds or portfolio solutions. The more active, the more specialized, or the more complex a fund is, the higher its MER tends to be, as these strategies require greater resources to manage effectively.
Regulatory Framework, Disclosure, and the CRM3 Evolution
In Canada, the disclosure of Management Expense Ratios is governed by securities regulations designed to ensure investor transparency. Funds are required to calculate and disclose their MER twice a year in key regulatory documents. The primary documents are the Fund Facts or ETF Facts, which must be provided to investors at the point of sale, and the Management Report of Fund Performance (MRFP). Investors can find a fund's most recent MER and a detailed breakdown of its components in the MRFP or the fund's simplified prospectus. These documents provide the official figures that investors should rely on for accurate cost comparisons.
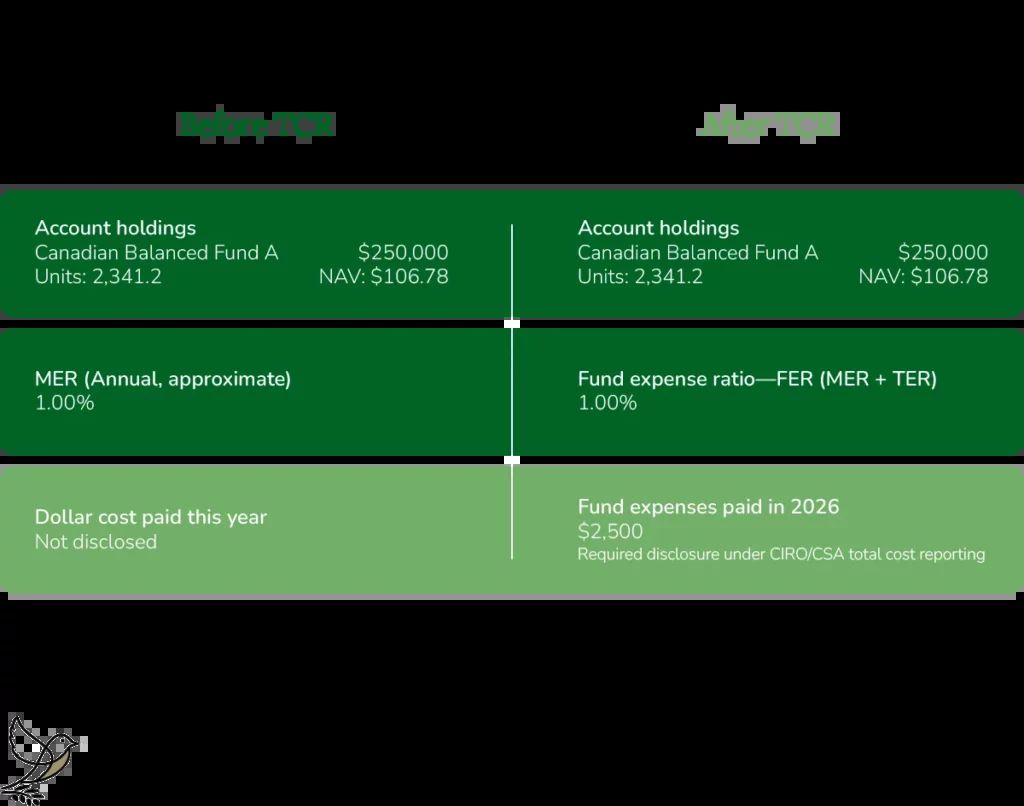
A significant regulatory evolution is the introduction of Total Cost Reporting (TCR), also known as Client Relationship Model Phase 3 (CRM3). This new requirement, set to begin in 2027, builds on the CRM2 reforms from 2016 which required dealers and advisors to deliver clients an annual performance report and an annual charges and compensation report. TCR mandates that investment firms include the embedded costs of products like mutual funds and ETFs in annual charges and compensation reports, showing them in both dollar and percentage terms. The goal is to provide greater clarity on the total cost of investing, though it introduces no new fees.
Under TCR, clients will see a Fund Expense Ratio (FER) on their statements. This FER may differ slightly from the MER published in semi-annual regulatory documents due to timing of fee changes or other calculation factors. This enhanced disclosure is part of a broader push for transparency, requiring firms to detail amounts paid for advice, general account administration, and trailing commissions received from fund managers. The trailing commission is explicitly noted as being paid out of the management fee, which is part of the MER. With TCR, investor statements will begin disclosing fees associated with qualifying investment types such as mutual funds and ETFs, providing a more complete picture of annual costs.
The Trading Expense Ratio and Total Fund Costs
While the MER covers most ongoing fund expenses, it does not include the cost of buying and selling securities within the portfolio. These trading costs are captured in a separate metric called the Trading Expense Ratio (TER). The TER represents the total brokerage commissions and any applicable taxes on those charges incurred by the fund over a reporting period, expressed as an annualized percentage of the fund's average daily net asset value. It is calculated by dividing the fund's total trading commissions by its total assets. Already published in regulatory documents like the Management Report of Fund Performance, the TER is also disclosed in the Fund Facts document which is required to be provided at point of sale.
The TER most commonly applies to funds that hold equities or trade derivative products like options and futures. Most fixed income funds do not have a significant TER because trading commissions for bonds are typically embedded in the security's price. However, fixed income funds that use derivatives for hedging may incur a TER for those transactions. Like the MER, the TER is disclosed in the Fund Facts document and the Management Report of Fund Performance. For a complete picture of a fund's costs, investors should consider both the MER and the TER together. The TER is shown as a yearly percentage based on the fund's average daily net asset value for the period, providing a standardized measure of trading efficiency.
Funds that invest primarily in equities will typically have a Trading Expense Ratio (TER). Many balanced or asset allocation funds will also have a TER due to their equity holdings. The TER, when combined with the Management Expense Ratio (MER), provides investors with the total ongoing cost of fund ownership, excluding one-time sales charges. Trading expenses also occur for funds that trade derivative products, such as options or futures. For example, certain funds like commodities pools can have a TER but do not trade equities, demonstrating that the TER is not exclusive to equity funds. Most fixed income funds do not have a TER because trading commissions are embedded in bond prices.
Impact of MERs on Long-Term Investment Returns
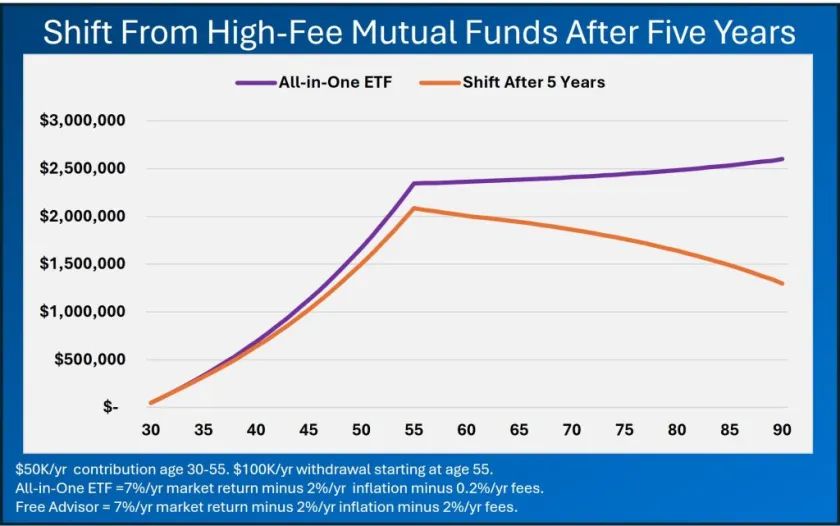
The Management Expense Ratio has a direct and compounding effect on an investor's long-term returns. Because the MER is deducted from the fund's assets annually, it reduces the net asset value upon which future growth is calculated. Over decades, even a small difference in MER can lead to a significant disparity in accumulated wealth. This creates a hurdle that the fund's gross returns must overcome before the investor sees a net gain.
The impact is especially pronounced when comparing passively managed index funds with low MERs to actively managed funds with higher MERs. The active fund manager must generate enough excess return, or alpha, to not only cover the higher fee but also to outperform the index net of fees. Industry guidelines often suggest that a reasonable expense ratio for an actively managed portfolio ranges from 0.5% to 0.75%, though many Canadian funds exceed this. Investors are encouraged to weigh the cost against the value received, which includes professional management, research, and advisor services. To illustrate, a $1,000 investment in a fund with a 0.8% trailing commission (part of the MER for Series A funds) would pay up to $8 in trailing commissions each year. This is why regulators emphasize fee transparency through CRM2 and the upcoming TCR, allowing investors to make more informed decisions about the cost-effectiveness of their investments. The MER impacts long-term investment returns more than many investors realize, making it a critical factor in portfolio selection and retirement planning.
Management Expense Ratios in Broader Financial Contexts
The term expense ratio is also used in corporate finance and for nonprofit organizations, though with different meanings than the investment fund MER. In corporate finance, the expense ratio measures operational efficiency by calculating operating expenses as a percentage of total revenue. This ratio indicates what portion of revenue is consumed by the costs of running the business, serving as a key metric for profitability analysis. It is calculated by dividing operating expenses by total revenue, and a lower ratio generally signals a more efficient operation.
For nonprofit organizations and charities, the relevant metric is the program expense ratio, which is program expenses divided by total expenses. This ratio, along with its counterpart the support service expense ratio (often called overhead), is a primary financial indicator for donors. Charities with a higher program expense ratio are often viewed as more efficient, directing more funds toward their mission. The sum of the program and support service ratios is 100% for any nonprofit. In the United States, the median support service expense ratio is 10%, and for most charities ranked by evaluators, expense ratios are less than 30%.
This broader context shows that while the Management Expense Ratio (MER) is a specific cost of owning an investment fund, the principle of measuring costs as a ratio of assets or revenue is a universal financial analysis tool. In corporate finance, the expense ratio measures operational efficiency by showing what percentage of total revenue is used for operating expenses. For nonprofit organizations, the program expense ratio, which is program expenses divided by total expenses, is a key financial indicator for charities and donors. In all contexts, a lower ratio generally indicates greater efficiency, but this must be balanced against the quality and outcomes of the services provided. The expense ratio can be an important indicator, especially if it is at an extreme, but it is also important to consider other factors like transparency, governance, leadership, and results when evaluating an organization or investment.
Frequently asked questions
What is a good MER for a mutual fund in Canada?
A reasonable expense ratio depends on the type of fund. For passively managed index funds or ETFs, MERs are often below 0.5%. For actively managed portfolios, industry guidelines often suggest a range of 0.5% to 0.75%. More specialized or complex funds, such as those focusing on emerging markets, typically have higher MERs. The key is to compare the MER against the fund's strategy and the value provided by professional management and research.
Where can I find the MER for a specific fund?
You can find a fund's Management Expense Ratio in its most recent Management Report of Fund Performance (MRFP). It is also disclosed in the Fund Facts or ETF Facts document, which must be provided to investors at the point of sale. These documents are available from the fund company or your financial advisor. The MER is calculated and published twice per year.
Do I pay the MER directly out of my pocket?
No, you do not pay the MER directly. The fee is paid by the fund itself. It is deducted from the fund's assets before the investment performance is calculated. This means the MER reduces the fund's net asset value, and the return you see quoted is the net return after all these expenses have been taken out.
What's the difference between Series A and Series F MERs?
Series A mutual funds have a bundled Management Expense Ratio (MER) that covers everything. It includes the management fee, operating expenses, taxes, and a trailing commission paid to the investment dealer and financial advisor. Series F mutual funds, available in fee-based accounts, have an MER that consists only of the management fee, operating expenses, and taxes. For Series F funds, fees for advice, access, and service are not included in the MER and are charged separately to the investor by the advisor's firm. Therefore, the published MER for a Series F fund is typically lower than for a Series A fund.
What is the Trading Expense Ratio (TER) and how is it different from the MER?
The Trading Expense Ratio (TER) covers the costs of buying and selling securities within the fund, such as brokerage commissions. The MER covers ongoing management and operational costs. The TER is expressed as an annualized percentage of the fund's assets and is disclosed separately in the Fund Facts and MRFP. For a full cost picture, consider both the MER and TER.
What is Total Cost Reporting (CRM3) and when does it start?
Total Cost Reporting (TCR), also known as Client Relationship Model Phase 3 (CRM3), is a new Canadian regulatory requirement designed to enhance transparency of investment fund costs. It represents the next phase following CRM2 rules from 2016. TCR introduces changes to the annual charges and compensation report by requiring the inclusion of the embedded costs of investment products like mutual funds and exchange traded funds (ETFs). These costs will be shown in both dollar terms and percentage terms. The requirement is scheduled to begin in 2027, at which point investor statements will disclose these fees. The goal of TCR is to provide greater transparency, not to introduce new fees.
Sources and further reading
- Management expense ratio (Wikipedia) en.wikipedia.org
- What is a management expense ratio (MER)? rbcgam.com
- Understanding Fees td.com
- What is a management expense ratio (MER)? canadalife.com
- Understanding fees and expenses | Scotiabank Canada scotiabank.com
This article explains how things work and is not financial, tax or legal advice. Rules, limits and rates change, so check the current figures with the Canada Revenue Agency, your province or your financial institution before you act.