A bear market is a period of widespread decline in stock prices, typically defined by a drop of 20% or more from recent highs over a sustained period. It represents a shift from investor optimism to widespread fear and pessimism, often coinciding with economic contraction. For Canadian investors, bear markets are a recurring feature of the financial landscape, influenced by global events, commodity prices, and domestic policy. Understanding these cycles is crucial for maintaining a long-term investment perspective and managing market volatility.
Definition and Key Characteristics
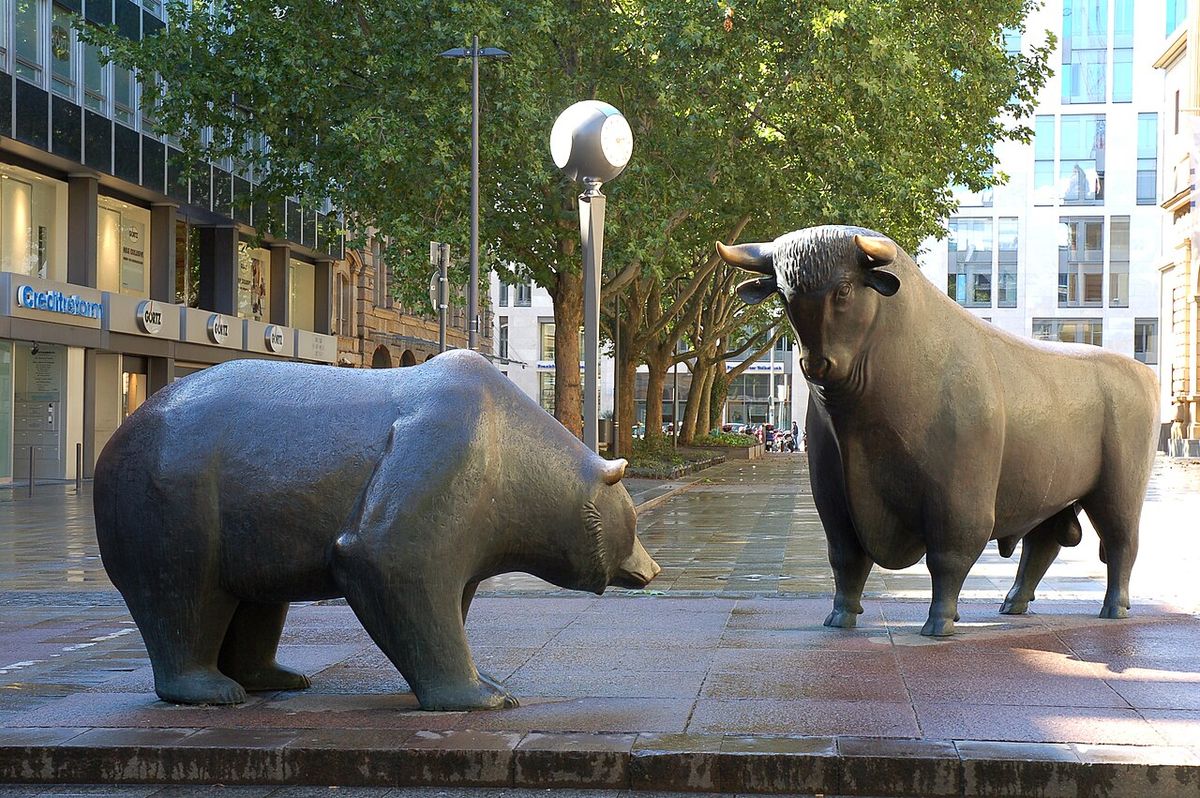
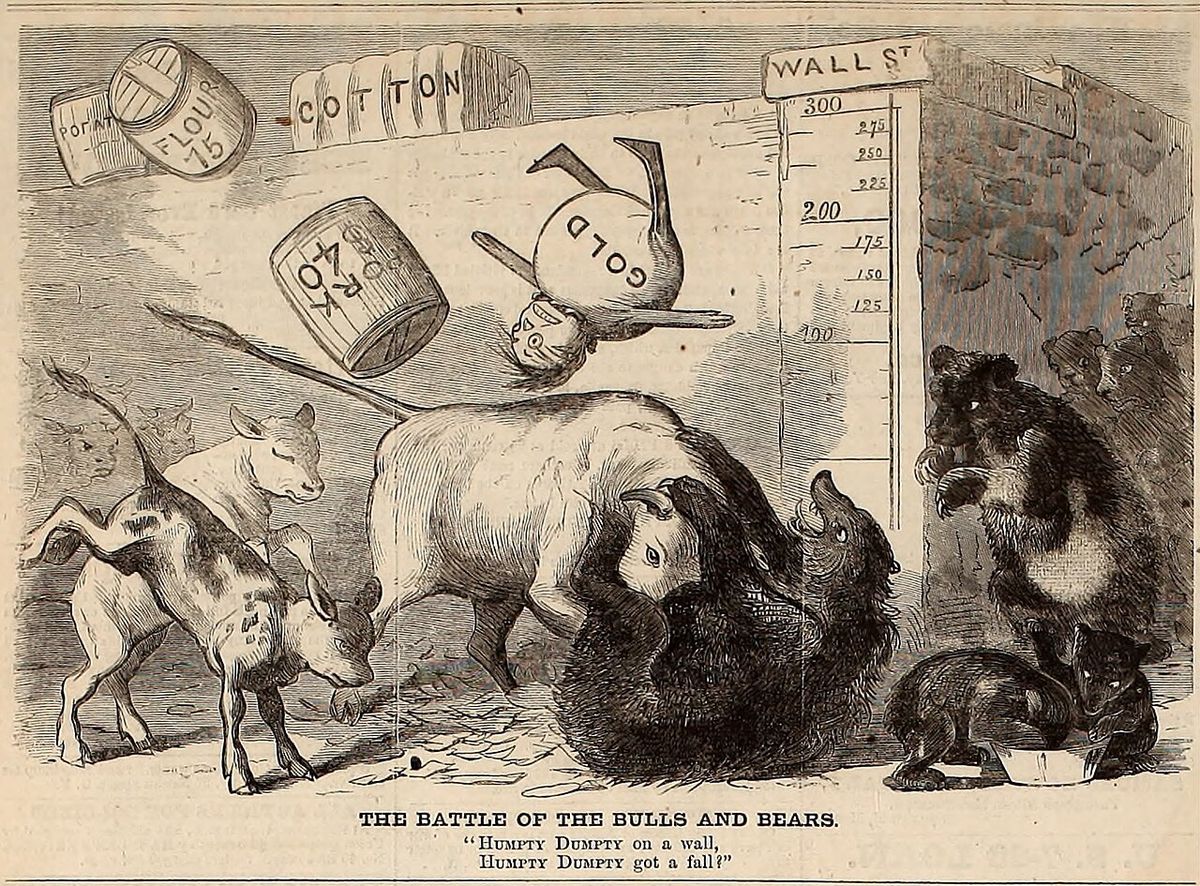
A bear market is formally defined as a broad decline in stock market prices of 20% or more from a recent peak. This downturn must persist for a minimum of two months to distinguish it from a shorter-term correction, which is a decline of 10% to 20%. The transition into a bear market is marked by a shift in market sentiment from high investor optimism to widespread fear and pessimism. This period involves a general decline in asset prices and a negative economic outlook, often reflecting or precipitating reduced consumer spending and economic contraction. The opposite condition, a bull market, is characterized by generally rising prices and investor optimism. The terms originate from 18th century London's Exchange Alley, where bear-skin jobbers sold shares before acquiring them and bulls bought shares on credit. According to Thomas Mortimer in 1761, bulls who bought in excess might be seen moaning for a buyer, while bears rushed about devouring shares to close their short positions.
How Bear Markets Work and Common Causes
Bear markets function through the fundamental dynamics of supply and demand within financial markets. During a downturn, a surge in selling pressure increases the supply of stocks while demand from buyers dwindles, leading to lower prices. This is often driven by investors attempting to reallocate their investments into perceived safer assets like government bonds. The price decline is typically triggered by events that erode corporate profits or cause valuation multiples to contract. Common catalysts include rapid increases in inflation and interest rates, the bursting of an asset bubble such as the dot-com or housing bubbles, or a loss of investor confidence due to events like a pandemic or geopolitical tensions. The flow of money into stocks slows significantly while outflows increase, causing market capitalization to vanish. A bear market often precedes or coincides with an economic recession, worsening conditions as it progresses. According to standard theory, a decrease in price typically leads to less supply and more demand, but for stocks this often reverses as investors buy high in euphoria and sell low in panic, driven by a herding instinct that disrupts the negative feedback loop and creates price instability.
Historical Bear Markets and Their Impact
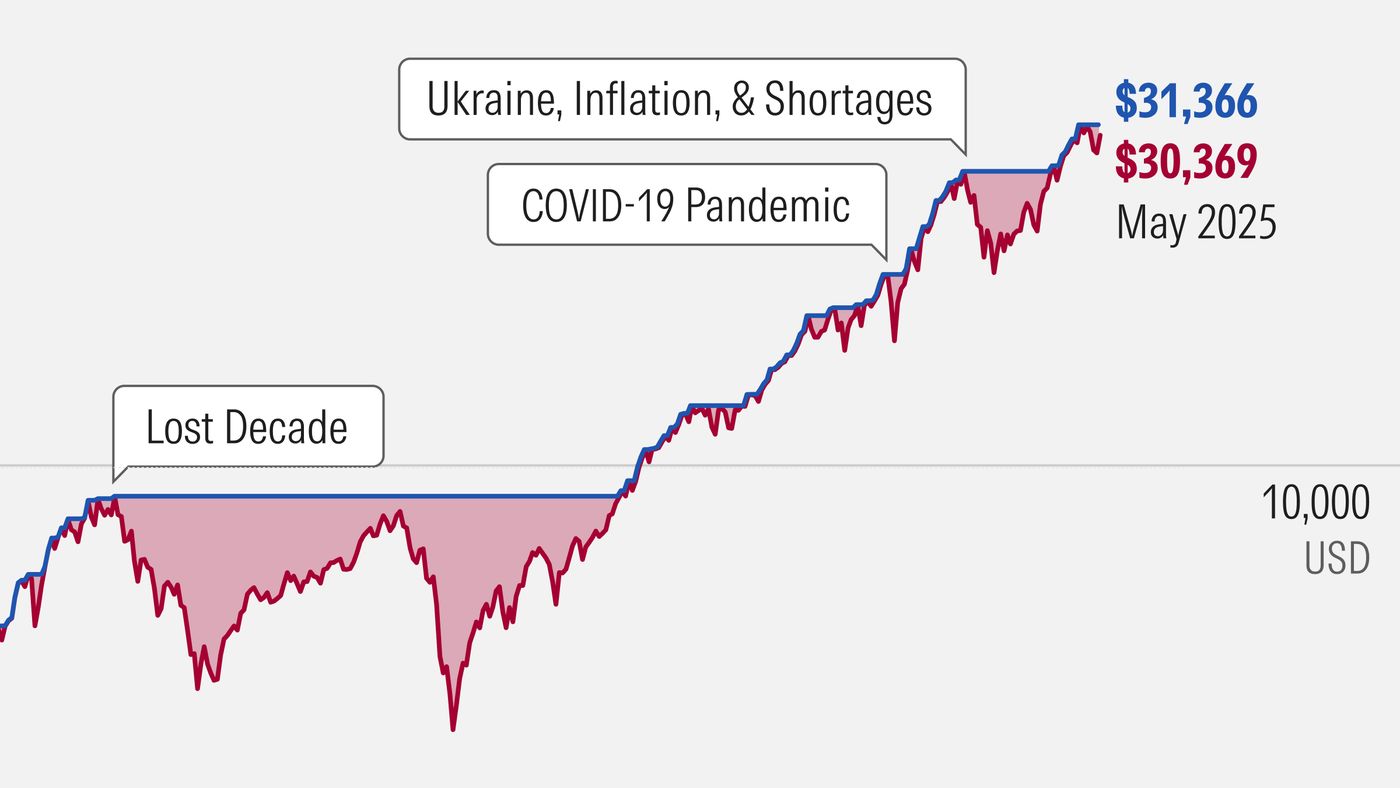
History provides numerous examples of bear markets and their profound economic impacts. The Wall Street Crash of 1929 erased 89% of the Dow Jones Industrial Average's value by July 1932, marking the start of the Great Depression. After regaining nearly half its losses, a longer bear market from 1937 to 1942 occurred where the market was again cut in half. Another long-term bear market occurred from about 1973 to 1982, encompassing the 1970s energy crisis and the high unemployment of the early 1980s. The dot-com bubble burst led to a significant downturn in 2002, while the 2008 financial crisis triggered a bear market from October 2007 to March 2009. The COVID-19 pandemic caused a rapid global bear market in early 2020. In 2022, concerns over inflation and rising interest rates led to another bear market. Analysis of U.S. data from 1926 to 2014 shows the average bear market lasted 13 months with a cumulative average loss of 30%. Annualized declines ranged from 19.7% to 47%. The most severe decline in modern history was the 87% drop between 1929 and 1932 during the Great Depression, and it took 22 years before the market exceeded its previous high.
Key historical bear market events include the Wall Street Crash of 1929, which erased 89 percent of the Dow Jones Industrial Average's market capitalization and marked the start of the Great Depression. A long-term bear market occurred from about 1973 to 1982, encompassing the 1970s energy crisis. The stock market downturn of 2002 followed the dot-com bubble, and a bear market occurred between October 2007 and March 2009 due to the 2008 financial crisis. More recent examples include the 2015 Chinese stock market crash, the global bear markets in early 2020 caused by the COVID-19 pandemic, and a bear market in 2022 driven by inflation concerns.
- 1929 to 1932: Wall Street Crash, Dow Jones lost 89%.
- 1937 to 1942: Second major decline during the Great Depression era.
- 1973 to 1982: Long-term bear market with energy crisis and high unemployment.
- 1992: Bear market in India following the stock market scam.
- 2000 to 2002: Dot-com bubble burst, Nasdaq fell 79% from its peak.
- 2007 to 2009: Financial crisis, S&P 500 fell 57% over 517 days.
- 2015: Chinese stock market crash.
- Early 2020: COVID-19 pandemic triggered global market crashes.
- 2022: Bear market driven by inflation surge and federal funds rate fears.
These events demonstrate that bear markets, while challenging, are a recurrent part of the financial cycle. From 1926 to 2014, the average duration of a bear market was 13 months, accompanied by an average cumulative loss of 30 percent. Some bear markets reached their bottoms very quickly, such as in 1987. Others took much longer, such as the one in 2002 which took up to 2.5 years. The bear market from 1929 to 1949 is described as a secular bear market, a long-term trend consisting of smaller bull markets and larger bear markets.
Bear Markets in the Canadian Context
The Canadian stock market, represented by indices like the S&P/TSX Composite, experiences bear markets that often mirror but do not exactly replicate U.S. trends due to interconnected financial systems. Canadian markets are additionally influenced by commodity prices, national policy moves, and Bank of Canada decisions. Since 1960, the S&P/TSX Composite Index has had an average annual return of 9.7% including dividends, despite periodic bear markets. Analysis of the TSX since 1960 shows that bear markets, defined as declines over 20%, have been shorter on average than bull markets. The average bear market in Canada lasts about 8 months with an average loss of approximately 32%. In contrast, bull markets last three to four years on average with average gains of about 92%. Between 1957 and 2024, there were ten distinct bull and bear market cycles for Canadian stocks. The most recent severe bear market for the TSX occurred in early 2020 during the COVID-19 pandemic, when the index declined 37% in what was the quickest bear market in history, lasting only 32 days. Severe bear markets with declines of 40% or more have been infrequent, occurring only three times since 1960, and they tend to be followed by sharp rebounds, sometimes gaining over 33% in the first year of recovery.
The performance of the Canadian market during select bear markets includes varied recoveries following declines. Recent bear markets with declines of more than 20 percent in the S&P/TSX Composite Index have seen recoveries such as a 205 percent return over 5 years following one downturn. Another example showed a 44 percent decline over one year. For Canadian investors, passive exposure through low-fee ETFs has been cited as an effective way to maintain diversified access to the TSX during volatility.
| Period | Event/Cause | Approximate TSX Decline & Notes |
|---|---|---|
| 2007 to 2009 | Global Financial Crisis | Significant decline mirroring global trends. |
| Early 2020 | COVID-19 Pandemic | 37% decline over 32 days, quickest on record. |
| 2022 | Inflation & Rate Hikes | Less severe than U.S., considered a correction. |
| Historical Average (since 1977) | Various | Average decline of 31.5%. |
Recent bear markets with declines of more than 20 percent in the S&P/TSX Composite Index have seen varied recoveries. One example is a 205 percent return over 5 years, which is an average of 24 percent per year. Another recovery saw an 84 percent return, and another a 42 percent return over 2 years. For Canadian investors, passive exposure through low-fee ETFs has been cited as an effective way to maintain diversified access to the TSX during such periods of market volatility.
Market Cycles: Tops, Bottoms, and Rallies
A bear market is typically preceded by a market top, the highest point prices reach before declining. Identifying a top is retrospective, but characteristics can include three to five distribution days in a major index within a short time, where a distribution day is a decline in price on higher volume than the preceding session. The peak of the dot-com bubble was on March 24, 2000, with the NASDAQ-100 at 4,704.73 and the Nasdaq at 5,132.50. The peak before the 2008 crisis was on October 9, 2007, with the S&P 500 at 1,565 and the NASDAQ at 2,861.50. The bear market concludes with a market bottom, marking a trend reversal and the start of a new bull market. Bottoms are notoriously difficult to identify in real time due to the risk of false rallies, a challenge often called 'bottom picking.' Baron Rothschild is often quoted as advising that the best time to buy is when there is 'blood in the streets,' when markets have fallen drastically and sentiment is extremely negative. A common indicator for the end of a bear market is when indices gain 20% or more from their low. Within a bear market, short-term price increases known as bear market rallies or dead cat bounces can occur. These are characterized by a price increase of 5% or more before prices fall again. Such rallies were observed after the 1929 crash leading down to the 1932 bottom, and throughout the late 1960s and early 1970s. The Japanese Nikkei 225 experienced several bear-market rallies between the 1980s and 2011 during a long-term downward trend.
Investor Sentiment and Key Indicators
Market sentiment acts as a contrarian indicator during bear markets. When an extremely high proportion of investors express bearish sentiment, it can signal a potential market bottom is near. Conversely, extreme bullish sentiment may suggest a market top. David Hirshleifer observed a trend phenomenon that starts with under-reaction and culminates in overreaction by investors. Several indicators gauge this sentiment. The Investor Intelligence Sentiment Index measures the Bull-Bear spread. A historic low spread may signal a bottom, while an extreme high in bullish sentiment may suggest a top. The American Association of Individual Investors sentiment indicator is considered significant when it reads minus 15% or below, suggesting the majority of the decline may have already occurred. Other useful indicators include the Cboe Volatility Index, which measures market volatility and anxiety, the Nova-Ursa ratio, the Short Interest/Total Market Float, and the put/call ratio. These tools help analysts assess the emotional state of the market, which often swings between under-reaction and overreaction. During a market decline, consumer sentiment typically drops, with expectations for unemployment rising and economic outlooks declining. Most recently, in April 2025, the United States stock market entered bear territory as the S&P 500 declined over 20% from its recent peak, a downturn attributed to escalating trade tensions and tariff policies.
Secular Trends and Long-Term Market Phases
Beyond typical bear markets, there are longer-term phases known as secular trends. A secular bear market is a lasting long-term trend that lasts 5 to 25 years and consists of a series of primary bear markets and smaller bull markets. An example occurred in the U.S. stock market from 1929 to 1949. Another example is the secular bear market in gold from January 1980 to June 1999, where the price fell from $850/oz to a low of $253/oz, culminating with the Brown Bottom. Conversely, a secular bull market consists of larger bull markets and smaller bear markets, such as the period in the United States from about 1983 to 2000 (or 2007), which included brief upsets like Black Monday and the 2002 downturn. Understanding these secular trends provides context for shorter bear markets, framing them as parts of much longer economic cycles. Analysts classify market trends as secular for long time-frames, primary for medium time-frames like a standard bear market, and secondary for short time-frames like corrections and rallies.
Risks, Debates, and Long-Term Perspective
The primary risk in a bear market is the permanent loss of capital for investors who sell during the downturn, locking in losses. A key debate centres on market timing, the attempt to sell before a decline and buy before a recovery. This is inherently a game of educated guessing, as future prices are unknown, and attempts often result in buying high and selling low. Another discussion involves the distinction between cyclical bear markets within longer secular trends. For long-term investors, historical data suggests that staying invested through downturns has been rewarded. For U.S. equities with holding periods longer than 5 years, the risk of capital loss is less than 10%. For periods over 10 years, it drops below 5%, and is zero for holding periods over 15 years. The average annual growth in U.S. equities over 97 years has been 9.9% per year, which was 6.8% higher than inflation and 6.6% higher than the return on cash. This underscores that bear markets, while volatile, are a normal phase within longer-term upward trends for equity markets. Contrarian investors employ a strategy of fading the herd, buying when others are selling in periods of distribution and selling when others are buying in periods of accumulation.
Strategies and Considerations for Investors
Bear markets present specific challenges and potential opportunities for investors. A common emotional reaction is panic selling, which can deepen losses and cause investors to miss the subsequent recovery. Historical analysis shows that investors who stay invested or even continue regular contributions can benefit from lower prices. Dollar-cost averaging through regular contributions allows investors to buy more shares when prices are low. Maintaining a well-diversified portfolio across asset classes, sectors, and geographies can help minimize volatility during a downturn. Investors are also advised to focus on company fundamentals, as high-quality companies with solid business plans, consistent profits, and low debt may be available at a discount. For those closer to retirement, a bear market may prompt a review of asset allocation towards more conservative options like bonds, GICs, or high-interest savings accounts. It is important to recognize that bear markets end unexpectedly, often when outlooks appear bleak, and rebounds can be sharp. Therefore, having a disciplined, long-term strategy aligned with personal goals is often more effective than attempting to time the market based on short-term fears or predictions. One study found that buy-and-hold investors consistently outperformed those who sold during market volatility.
Frequently asked questions
How long do bear markets typically last?
The average duration of a bear market varies by market. Analysis of U.S. data from 1926 to 2014 found an average length of 13 months. In Canada, based on TSX data since 1960, the average bear market lasts about 8 months. However, durations can range widely from very short drops, like the 32-day bear market in 2020, to prolonged multi-year declines like the one from 1929 to 1932.
How have Canadian bear markets performed historically?
Since 1960, bear markets in the TSX Composite Index have seen an average loss of about 32% and lasted an average of 8 months. This is shorter than the average bull market, which lasts three to four years. Despite these downturns, the TSX has delivered an average annual return of 9.7% including dividends since 1960. Severe bear markets with declines over 40% are rare, occurring only three times since 1960.
What is the difference between a bear market and a correction?
The key difference is the severity and duration of the decline. A correction is a decline of 10% to 20% from a recent high. A bear market is a more severe decline of 20% or more that persists for a longer period, typically at least two months. Corrections are more frequent and can occur within both bull and bear markets, while a bear market represents a fundamental shift in market sentiment and economic conditions.
What exactly defines a bear market?
A bear market is a general decline in the stock market over a period of time, defined by a price decline of 20% or more over at least a two-month period. This period involves a transition from high investor optimism to widespread investor fear and pessimism. A smaller decline of 10% to 20% is classified as a correction, not a full bear market. The term describes a downward market trend and originates from 18th-century London traders known as 'bear-skin jobbers' who sold shares before acquiring them. In a secular bear market, which can last 5 to 25 years, the prevailing long-term trend is downward-moving, consisting of larger bear markets and smaller bull markets.
What causes a bear market?
Bear markets are caused by shifts in supply and demand for assets, driven by events that lead to widespread investor pessimism and economic contraction. These events can include financial crises like the 2008 crash, the bursting of asset bubbles such as the dot-com bubble, geopolitical tensions, pandemics like COVID-19, or policies causing uncertainty such as trade tariffs. The recent example from April 2025 attributes a market decline to escalating trade tensions under the Trump administration. Fundamentally, prices fall when selling increases, often because investors driven by fear sell stocks low, disrupting the typical negative feedback loop of supply and demand and creating price instability.
What signals the end of a bear market?
A bear market concludes when stocks recover in a sustained rally, reaching new highs. This end is assessed retrospectively from the recent peak to the lowest closing price and then to the new high. A commonly accepted indicator is when market indices gain 20% or more from their lowest point. Identifying the exact market bottom is challenging as upturns may be false rallies, sometimes called 'sucker's rallies' or 'dead cat bounces'. Historically, the average bear market from 1926 to 2014 lasted 13 months with an average cumulative loss of 30%. The end of the bear market marks the start of a new bull market phase.
Sources and further reading
- Bear market (Wikipedia) en.wikipedia.org
- Understanding the Canadian Bear Market: Why Holding ... tsinetwork.ca
- How to invest in a bear market td.com
- Bull vs. Bear market: The basics explained | Posts scotiabank.com
- Don't fear the bear edwardjones.ca
- Bulls and Bears dynamic.ca
This article explains how things work and is not financial, tax or legal advice. Rules, limits and rates change, so check the current figures with the Canada Revenue Agency, your province or your financial institution before you act.