The average annualized total return of the S&P 500 index, including reinvested dividends, has been roughly 9.8 percent over the past 90 years. For the period from 1957, when the index expanded to 500 companies, to 2025, the average annualized rate of return was approximately 10.33 percent. This historical performance makes the S&P 500 a key benchmark for U.S. stock market health, which is relevant to Canadian investors seeking diversified exposure through funds. Understanding this average return, its components, and how it compares to Canadian indices provides essential context for long-term investment planning.
What the S&P 500 Average Return Represents
The average return figures for the S&P 500 are calculated as annualized total returns, which include both price appreciation and reinvested dividends. This total return measure provides a more complete picture of an investor's potential gain than looking at price changes alone. The index itself is a market-capitalization-weighted benchmark tracking 500 of the largest public companies listed on U.S. stock exchanges. It was first composed of 90 companies in 1926, known then as the Composite Index or S&P 90, before expanding to 500 components in 1957. The long-term average of roughly 10.33 percent from 1957 to 2025 illustrates the compounded growth potential of the U.S. equity market over extended periods.
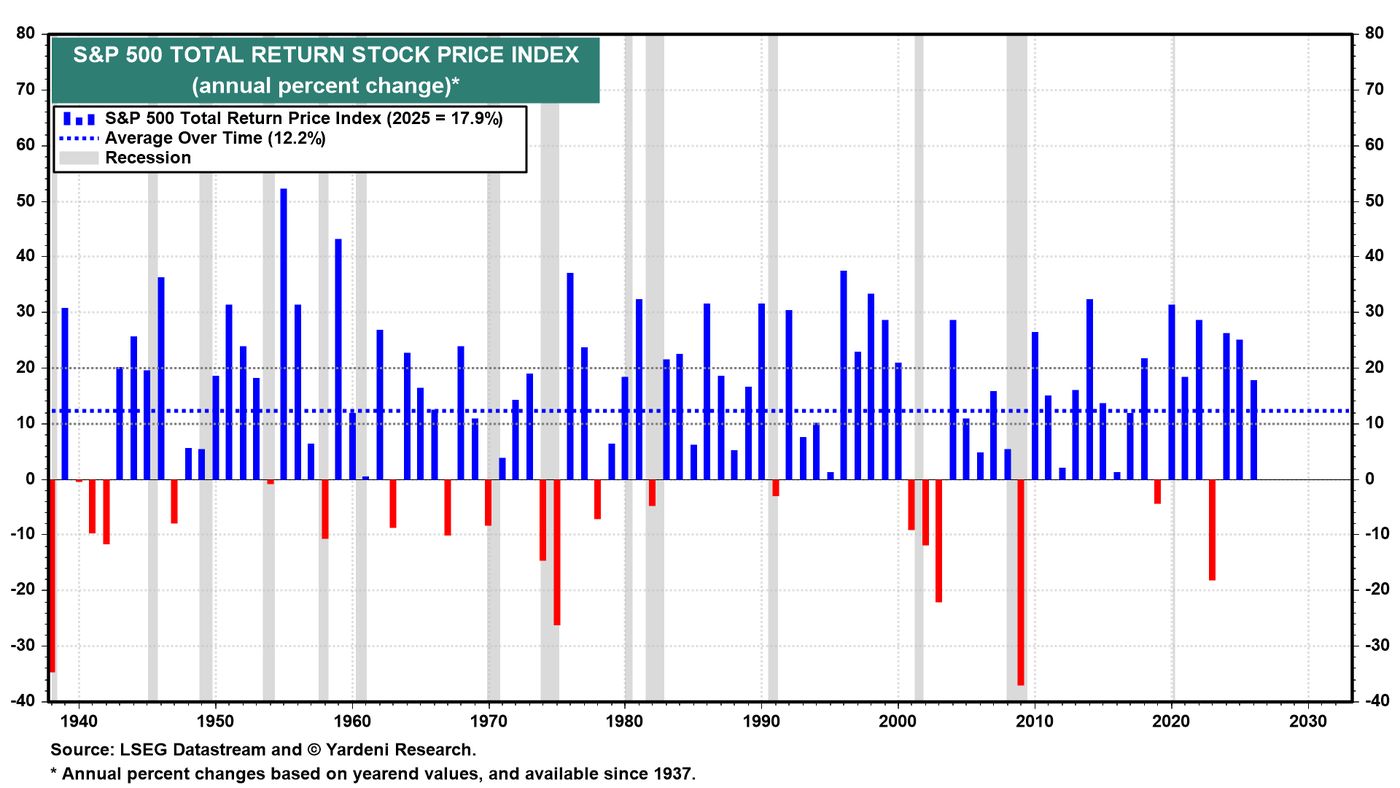
It is crucial to understand that this average is a historical figure and does not guarantee future results. The average smooths out these annual volatilities to show a trend. For Canadian investors, this U.S. benchmark often serves as a point of comparison for domestic market performance, such as the TSX Composite Index, which had an average annualized return of 7.94 percent over a 50-year period. Analyzing these figures helps in assessing the risk and return characteristics of different equity markets.
Key Components of S&P 500 Returns
The total return of the S&P 500 has two primary components that together create the average figures investors cite. The first component is the price return, which is the change in the index's level based solely on the fluctuating share prices of its constituent companies. The second, and equally important, component is the return generated by dividends paid out by those companies. When dividends are reinvested to purchase more shares, they contribute to compounding returns over time. Most published long-term average returns, including the 9.8 percent figure over 90 years and the 10.33 percent figure since 1957, assume the reinvestment of all dividends.
Focusing only on price returns would understate the historical performance of the index. The role of dividends becomes especially powerful over decades, as the reinvestment process buys more shares, which then generate their own dividends and price appreciation. This mechanism of compounding is a fundamental driver of wealth creation in equity investing. For investors using S&P 500 index funds, the fund manager typically handles the dividend collection and reinvestment process automatically, which is reflected in the fund's unit price or through distributions of additional units.
How Canadian Investors Access the S&P 500
Canadian investors cannot invest directly in the S&P 500 index itself, as it is purely a measurement gauge. Instead, exposure is gained through financial products that replicate the index's composition and performance. The most common vehicles are exchange-traded funds (ETFs) and index mutual funds that track the S&P 500. These funds aim to hold the same stocks in the same proportions as the index, thereby delivering returns that closely mirror its performance before fees. ETFs trade on stock exchanges like the Toronto Stock Exchange (TSX) throughout the trading day, while mutual funds are priced once daily after markets close.
To purchase an S&P 500 ETF, an investor needs an account with an online brokerage platform. Some Canadian brokerages offer commission-free ETF purchases, though the specific terms vary by platform. Investors should look for a platform that supports their desired account type, such as a Tax-Free Savings Account (TFSA) or Registered Retirement Savings Plan (RRSP), and provides access to ETFs listed on the TSX. The choice of account has significant implications for the taxation of investment gains, which is a key consideration for Canadian investors alongside the fund's performance.
Account Types for Holding S&P 500 Investments in Canada
The account in which you hold an S&P 500 fund determines how your investment returns are taxed under Canadian law. The three primary account types are Tax-Free Savings Accounts (TFSAs), Registered Retirement Savings Plans (RRSPs), and non-registered accounts. A TFSA shelters all investment gains from Canadian tax entirely, meaning you pay no tax on growth or withdrawals. However, U.S. dividends paid into a TFSA are subject to a 15 percent U.S. withholding tax that cannot be recovered by the Canadian investor. An RRSP provides a tax deduction on contributions, lowering your taxable income in the contribution year, and growth within the plan is tax-deferred.
Non-registered accounts offer the most flexibility with no contribution limits or withdrawal restrictions, but all investment gains are taxable in Canada. This includes capital gains when shares are sold and distributions like dividends. The choice between these accounts involves balancing current tax benefits, future tax liabilities, and contribution room. Many Canadian investors use a combination of account types to optimize their overall tax situation while building a portfolio that includes U.S. market exposure through S&P 500 index funds.
- Tax-Free Savings Account (TFSA): Shelters all Canadian tax on growth and withdrawals.
- Registered Retirement Savings Plan (RRSP): Provides a tax deduction on contributions and tax-deferred growth.
- Non-registered account: Offers no tax shelter. All investment gains are taxable.
- U.S. withholding tax: A 15% tax on U.S. dividends paid into a TFSA, which cannot be recovered.
Factors to Compare When Choosing an S&P 500 ETF
Several S&P 500 ETFs are listed on the TSX, and they differ in features that can impact net returns. The management expense ratio (MER) is the annual fee charged by the fund, expressed as a percentage of assets. For Canadian-listed S&P 500 ETFs, MERs typically range from about 0.08 percent to 0.10 percent. A lower MER means more of the index's gross return stays in the investor's pocket over time. Another critical factor is currency hedging. Since the S&P 500 is denominated in U.S. dollars, a hedged ETF aims to neutralize the impact of CAD/USD exchange rate fluctuations on returns, while an unhedged ETF does not.
Tracking accuracy measures how closely the ETF's returns match the actual index's returns. Investors should review a fund's tracking difference, which is the gap between the ETF's return and the index's return over time. A smaller tracking difference generally indicates a more efficiently managed fund. The choice between hedged and unhedged versions is not inherently right or wrong. It depends on an investor's outlook on currency movements and investment time horizon. These factors, cost, currency strategy, and tracking, are essential for Canadian investors to evaluate when selecting a specific fund.
- Management Expense Ratio (MER): Typically 0.08% to 0.10% for Canadian-listed S&P 500 ETFs.
- Currency Hedging: A strategy to neutralize CAD/USD exchange rate impact on returns.
- Tracking Accuracy: Measured by the tracking difference between the ETF and the index.
- Unhedged ETF: Leaves returns exposed to currency exchange rate fluctuations.
Annual Returns and Recent Performance Data
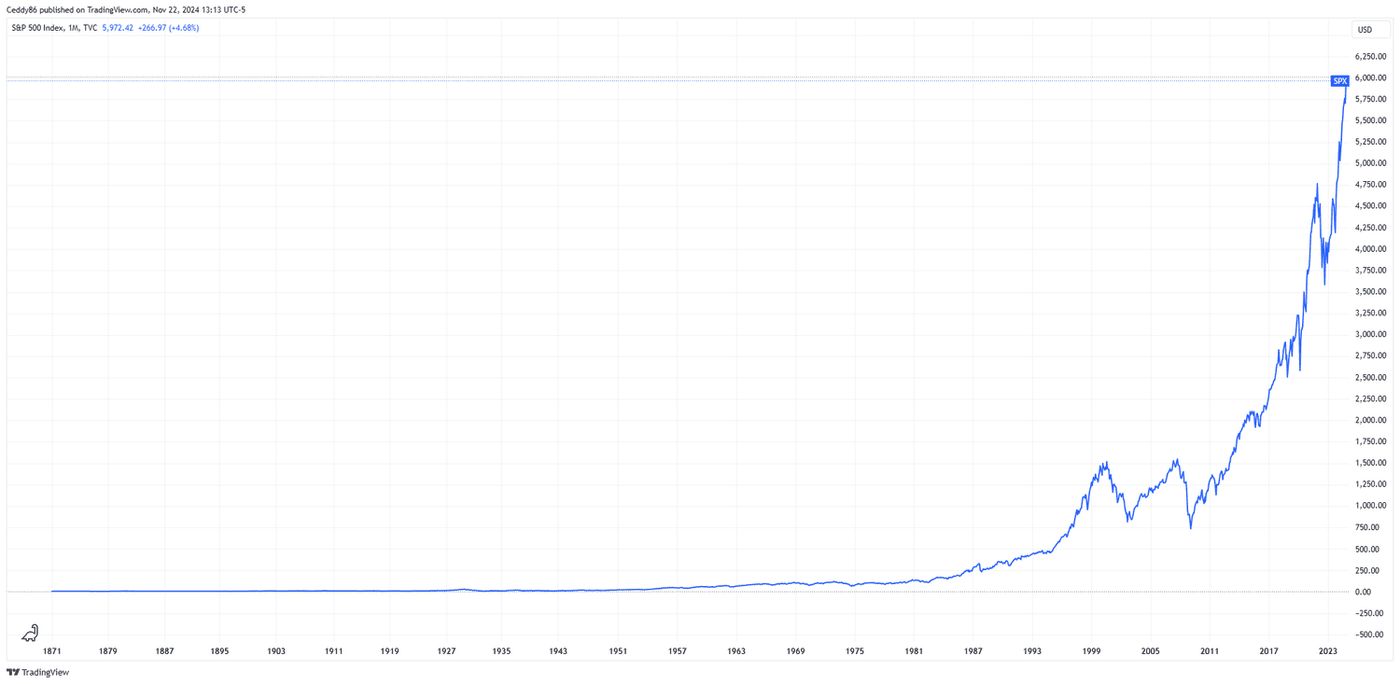
The S&P 500's return varies considerably from year to year, which is why the long-term average is a smoothed figure. Recent annual total returns demonstrate this volatility, with 2021 seeing a return of 28.71 percent, followed by 18.40 percent in 2020 and 31.49 percent in 2019. The index also experiences negative years, such as 2018's return of negative 4.38 percent. More current data shows the index at 7,690.73 USD on October 19, 2026, which was a 15.4 percent increase from its level one year earlier.
Performance over different recent periods provides additional context. Over the past five years leading into 2026, the index grew at an annualized rate of 11.2 percent. These shorter-term figures can differ from the multi-decade averages and highlight the non-linear path of market growth. Canadian investors monitoring these returns should remember that the figures are typically reported in U.S. dollars, and their personal return in Canadian dollars will also be affected by exchange rate movements unless they use a hedged fund.
- 2021 Total Return: 28.71%
- 2020 Total Return: 18.40%
- 2019 Total Return: 31.49%
- 2018 Total Return: -4.38%
- 5-Year Annualized Growth (to 2026): 11.2%
Common Considerations for Canadian Investors
Investing in a broad index like the S&P 500 involves accepting market risk, which refers to the chance that actual returns will deviate from expected returns, both positively and negatively. This risk encompasses factors like economic competition, geopolitical events, and broader market cycles. The historical average return of roughly 10 percent is associated with this risk. There is no guarantee of achieving it. For diversification, a single S&P 500 index fund provides exposure to 500 large U.S. companies across multiple sectors, which reduces the impact of any single company's poor performance on the overall portfolio.
The power of compounding is a key reason long-term averages are emphasized. By reinvesting dividends and allowing returns to generate further returns, investment value can grow significantly over decades. This process requires time and patience. When comparing the S&P 500's historical average to the TSX Composite's 7.94 percent average over 50 years, investors can observe different risk-return profiles for the U.S. and Canadian markets. Ultimately, incorporating S&P 500 exposure is a strategic decision for Canadian portfolios, focusing on long-term growth potential within a diversified, cost-effective structure.
Frequently asked questions
How can I invest in the S&P 500 from Canada?
Canadian investors gain exposure to the S&P 500 through exchange-traded funds (ETFs) or index mutual funds that track the index. These funds are listed on exchanges like the Toronto Stock Exchange and can be purchased through an online brokerage account. You cannot invest directly in the index itself. It is important to compare factors like the management expense ratio (MER), currency hedging, and tracking accuracy when selecting a specific fund.
Should I hold an S&P 500 ETF in a TFSA or RRSP?
Both TFSA and RRSP accounts are common for holding S&P 500 investments. A TFSA shelters all Canadian tax on growth and withdrawals, but U.S. dividends are subject to a 15 percent withholding tax that is not recoverable. An RRSP provides a tax deduction on contributions and allows for tax-deferred growth. The choice depends on your income, contribution room, and tax planning objectives, with many investors using a combination of account types.
What is the difference between price return and total return?
Price return measures only the change in the index level or share price. Total return includes both price appreciation and the returns generated by dividends, assuming those dividends are reinvested. The widely cited long-term average returns for the S&P 500, such as 9.8 percent or 10.33 percent, are total returns. Dividends play a significant role in compounding wealth over extended periods.
How does the S&P 500 return compare to the Canadian stock market?
Historically, the S&P 500 has shown a different average return profile than the Canadian market. Between 1957 and 2025, the S&P 500 averaged about 10.33 percent annually. Over the 50-year period from November 1971 to November 2021, the TSX Composite Index averaged an annualized return of 7.94 percent. These figures illustrate varying historical performances between the two major North American equity markets.
What is the average return of the S&P 500?
The average annualized total return of the S&P 500, including reinvested dividends, is approximately 9.8 percent over the past 90 years. For the period from 1957, when the index expanded to 500 companies, to 2025, the average annualized rate of return was roughly 10.33 percent. The index has delivered varying returns in recent years, such as 23 percent in 2024 and 24 percent in 2023. These figures represent long term historical averages and do not predict future performance, which can vary significantly in any given year. The S&P 500 is a market capitalization weighted index tracking 500 large US companies, and its total returns include both price changes and dividends.
Sources and further reading
- S&P 500 Total Returns by Year Since 1926 slickcharts.com
- What is the average rate of return of the stock market? questrade.com
- How to invest in the S&P 500 in Canada | 2026 guide wealthsimple.com
This article explains how things work and is not financial, tax or legal advice. Rules, limits and rates change, so check the current figures with the Canada Revenue Agency, your province or your financial institution before you act.