Profit margin is a fundamental financial ratio that measures the percentage of revenue a company retains as profit after all expenses are paid. It is a key indicator of a business's operating efficiency, pricing strategy, and overall financial health. In Canada, profit margins vary widely by industry and have been a subject of significant economic debate, especially following the pandemic. Understanding profit margin is essential for business owners, investors, and anyone analysing the competitiveness and stability of Canadian enterprises.
What Profit Margin Is and How It Is Calculated
Profit margin is a financial ratio expressed as a percentage that shows how much profit a company earns for every dollar of revenue it generates. It provides a comprehensive picture of a business's operating efficiency by comparing profit to sales. The basic profit margin formula is profit divided by revenue, multiplied by 100. For example, if a company reports a 35 percent profit margin, it means it nets $0.35 from each dollar of sales. This metric is distinct from profit percentage or markup, which calculates profit as a percentage of cost price rather than selling price. Profit margin is used primarily for internal comparison and to assess a company's pricing strategies and cost control. A low profit margin indicates a low margin of safety, meaning a decline in sales could more easily erase profits and result in a net loss.
The calculation hinges on accurately defining profit and revenue. Profit is revenue minus total expenses. If an investor generates $10 in revenue at a cost of $1, the profit is $9, resulting in a 90 percent margin. If the cost to earn that $10 is $5, the margin is 50 percent. This demonstrates how the margin reflects the portion of revenue kept as earnings. Profit margins can include elements like risk premiums and monopoly profits, distinguishing them from simple rates of return. Because individual businesses have varying operating and financing arrangements, comparing profit margins across different entities can be difficult and may have little meaning without context.
The Three Main Types of Profit Margin
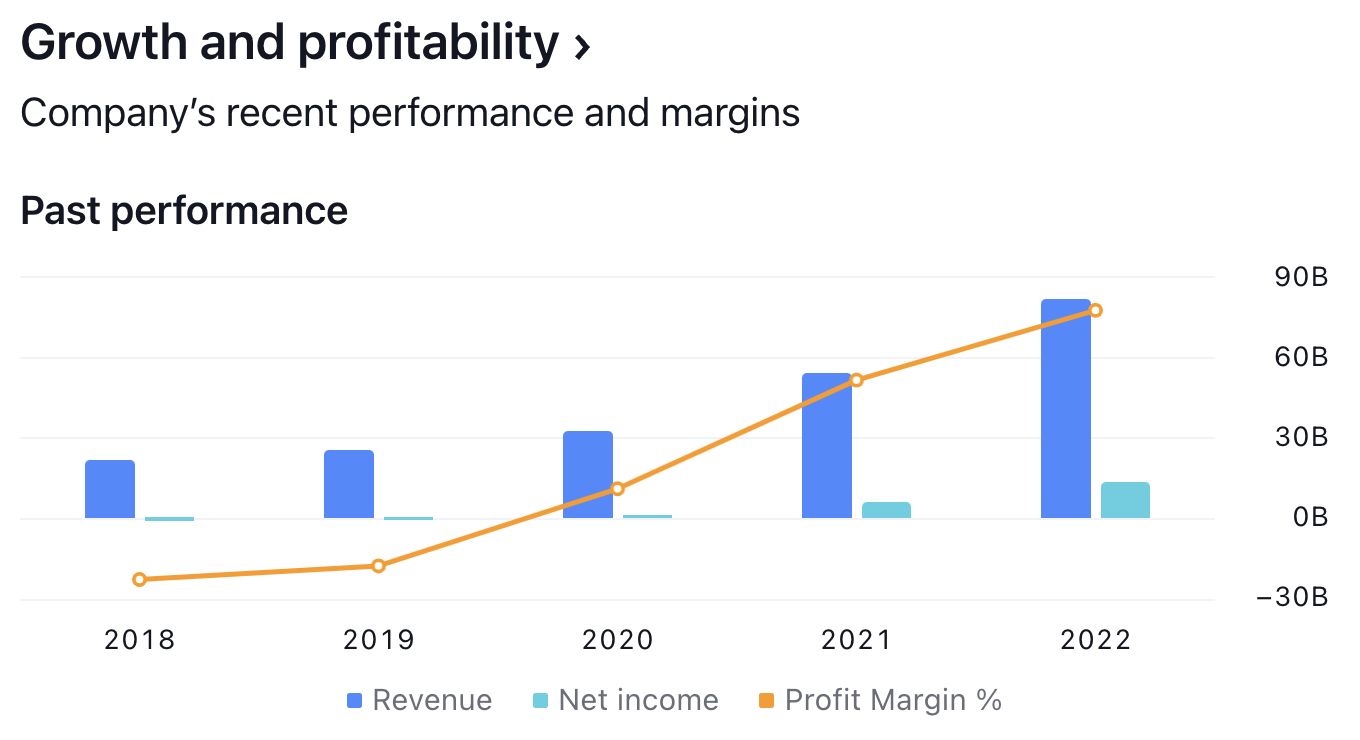
Business analysts break down profitability into three specific margin types, each providing a different level of insight into financial performance. Gross profit margin is the most basic, calculated as gross profit divided by net sales. Gross profit is revenue minus the cost of goods sold, which includes direct costs like materials, labour, and factory overhead. For service companies, the cost of revenue is used instead. This margin is a snapshot of production efficiency.
Operating profit margin provides a deeper view by including operating expenses. It is calculated as operating income, or earnings before interest and taxes, divided by revenue. Operating income is revenue minus both the cost of goods sold and operating expenses like rent and salaries. If a company has $1,000,000 in revenue, $600,000 in COGS, and $200,000 in operating expenses, its operating profit is $200,000, yielding a 20 percent operating profit margin. This metric focuses on the profitability of core business activities before financing and tax considerations.
Net profit margin is the most comprehensive measure, reflecting the bottom line. It is net profit divided by revenue, where net profit is revenue minus all expenses, including operating costs, interest, and taxes. Using the same example with an added $50,000 tax expense, net profit becomes $150,000, resulting in a 15 percent net profit margin. This figure shows the actual percentage of revenue that ends up as after-tax profit, indicating the company's overall financial health and its ability to generate returns for owners and investors.
Profit Margin Trends and Data in Canada
Profit margins in the Canadian economy have shown significant shifts, particularly around the COVID-19 pandemic. Historically, between 2010 and 2019, the average pre-tax profit margin for corporations was 8.1 percent. During the pandemic, margins increased markedly, averaging over 12 percent in 2021 and 2022. In 2023, the average pre-tax profit margin remained well above pre-pandemic levels at 10.7 percent. Total pre-tax corporate profits reached $644 billion in 2023, which is 54 percent higher than in 2019 and more than double the average profit levels of the pre-pandemic decade. This increase in margins suggests corporations increased prices more than their input costs rose during this period.
These trends have not been uniform across all sectors. Profit margins remained above their pre-pandemic average in 18 of the 21 largest non-financial industries in 2023. The oil and gas extraction sector saw the most dramatic shift, moving from an average pre-pandemic profit margin of -5.4 percent to a positive 17.6 percent margin in 2023. Grocery stores, typically a low-margin industry, saw their profit margin double from a pre-pandemic average of 2.0 percent to 4.1 percent in 2023. In contrast, the industry of other miscellaneous merchant wholesalers had a pre-tax profit margin of 6.4 percent in 2023.
Despite record profits, corporate investment in the Canadian economy did not correspondingly increase. Average non-financial corporate investment was $205.9 billion per year from 2010 to 2019 and was virtually unchanged at $205.1 billion per year from 2021 to 2023. Instead, a significant portion of profits was used for shareholder returns. In 2023, dividends and share repurchases accounted for 68.2 percent of non-financial corporations’ net profits. This dynamic has fueled debates about the relationship between corporate profits, investment, inflation, and income inequality in Canada.
Industry Benchmarks and High-Margin Sectors
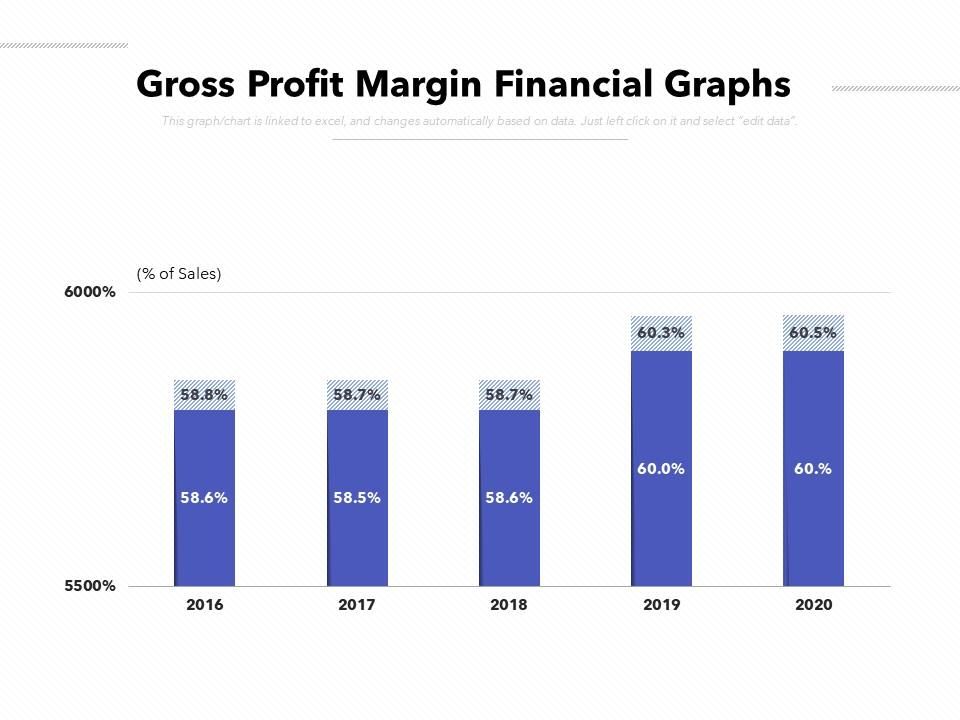
Profit margins vary dramatically across different industries in Canada, influenced by factors like business model, competition, and cost structures. Benchmarking against industry averages is a crucial practice for businesses to gauge their performance. For many types of businesses, such as retailers, a gross profit margin ratio of 50 to 70 percent is considered healthy. However, net profit margins are typically much lower after accounting for all expenses. The grocery industry is a classic example of a low-margin sector, with profit margins historically averaging around 3 to 4 percent.
Some industries are characterized by consistently high profitability. According to industry analyst data, the sector with the highest projected profit margin in Canada for 2026 is Primary Care Doctors, with an estimated margin of 85.7 percent. This is followed by Day Care and Home Care Providers. These high margins often reflect service-based models with relatively lower costs of goods sold and specific market structures. In contrast, wholesale trade industries show more moderate figures. For instance, in 2023, cost of goods sold accounted for 77.9 percent of total expenses for wholesalers nationally, with total labour remuneration at 6.2 percent and other operating expenses at 15.8 percent.
- Primary Care Doctors: 85.7% profit margin (2026 projection).
- Day Care and Home Care Providers: High margin sector (2026).
- Grocery Stores: 3-4% average profit margin.
- Oil and Gas Extraction: 17.6% margin in 2023.
- Other Miscellaneous Merchant Wholesalers: 6.4% margin in 2023.
Understanding these benchmarks helps businesses set realistic financial goals. A company with a net profit margin above its industry average is generally considered efficient and competitive. Conversely, a margin below average signals an opportunity to analyse operational costs, pricing strategies, or other inefficiencies. Bankers and investors use these industry comparisons to evaluate financing requests and assess a company's potential and risk relative to its peers.
Practical Uses and Importance for Business
Profit margin serves as a vital diagnostic tool for business management and strategic planning. Its primary importance lies in providing a clear, standardized measure to evaluate a business's potential and capacity to generate profits. By analysing margins over time, owners and managers can assess whether profitability is improving or deteriorating, which helps in making informed operational and investment decisions. For example, a declining net profit margin on rising sales could indicate that costs are growing faster than revenue, prompting a review of operational efficiency or pricing strategy. This metric acts as an early warning system for cash flow challenges and potential losses.
Profit margin is also crucial for external stakeholders. It is a key factor for lenders when evaluating a company's creditworthiness and its ability to service debt. Banks typically review net profit margin trends over three to five years as part of a financing assessment. For investors, profit margin is one of several factors used to predict future performance and compare companies within the same industry. A higher profit margin can make a company a more attractive investment opportunity, as it suggests better cost control and pricing power. Furthermore, profit margins can be used to identify inefficient product lines or operational areas where costs are too high relative to the profits generated.
In the context of business relationships, profit margin can even feature in supply contracts. There have been instances, such as in the UK grocery sector, where retailers have required suppliers to cover profit margin shortfalls. While this highlights the contractual importance of margins, it also underscores the pressure on suppliers to maintain their own profitability. Ultimately, a healthy profit margin improves a business's financial stability, enhances its ability to obtain loans, and provides the resources needed for growth and weathering economic downturns.
Key Calculations and Formulas
Accurately calculating profit margin requires applying the correct formulas to financial data, typically drawn from income statements. The foundational formula for profit margin is (Profit / Revenue) × 100, where profit is sales minus total expenses. To calculate the specific types of margin, different profit figures are used. For gross profit margin, the formula is (Revenue, Cost of Goods Sold) / Revenue × 100. This reveals the percentage of revenue left after direct production costs. For a business with $200,000 in revenue and $120,000 in COGS, the gross profit margin is 40 percent.
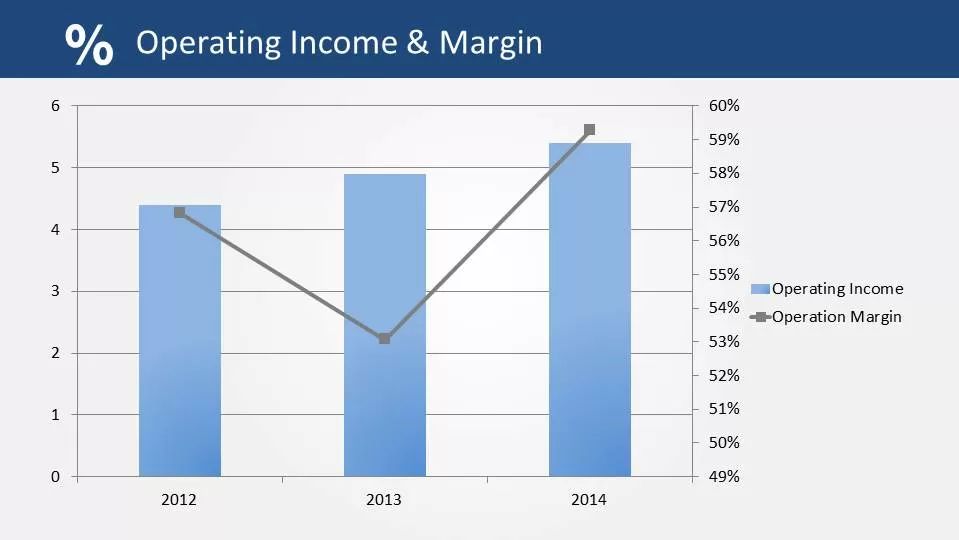
Operating profit margin uses operating income, which is revenue minus COGS and operating expenses. The formula is Operating Income / Revenue × 100. If operating expenses are $50,000 on top of the $120,000 COGS, operating income is $30,000, yielding a 15 percent operating margin. Net profit margin, the most comprehensive calculation, is Net Profit / Revenue × 100, where net profit is the after-tax income. These calculations can be performed on an annual, quarterly, or monthly basis to monitor performance, though interim calculations require estimated adjustments for taxes and depreciation.
| Margin Type | Formula | Example Calculation |
|---|---|---|
| Gross Profit Margin | (Revenue, COGS) / Revenue × 100 | ($200,000, $120,000) / $200,000 × 100 = 40% |
| Operating Profit Margin | Operating Income / Revenue × 100 | $30,000 / $200,000 × 100 = 15% |
Understanding these formulas allows business owners to deconstruct their income statement and pinpoint where profits are being generated or eroded. A change in net profit margin should trigger a detailed review of all expense categories, from material costs and labour to administrative overhead and financing charges. This analytical process is essential for maintaining financial health and driving strategic business conversations about efficiency and growth. By analysing the profitability of different product lines, companies can identify areas where costs are too high in relation to the profits generated.
Debates and Economic Implications in Canada
Conventional economic theory suggests that profits reflect the marginal productivity of capital, but this theory struggles to explain the economy-wide increase in margins observed during and after the pandemic. Analysis indicates that increasing profit margins reflect an increase in firms' price-setting power, potentially due to reduced competition and policies less favourable to labour organizations. This market power allowed corporations to increase prices far more than their input costs increased, contributing to the high inflation experienced since 2021. This phenomenon has direct implications for income inequality and economic growth. Increased corporate profit margins have been identified as a contributor to rising income inequality. Furthermore, the expectation that higher profits lead to increased corporate investment has not materialized in recent years. Despite profits doubling after the pandemic, non-financial corporations did not increase their investment in the Canadian economy, choosing instead to allocate a large share of profits to dividends and share repurchases. This has led to calls for new policies to curb the power of large corporations and ensure a fairer distribution of resources.
Proposed policy responses include increasing the corporate income tax rate, implementing a minimum tax on book profits, and preventing further corporate consolidation. These measures aim to bring profit margins back down to pre-pandemic averages and raise public revenue for investment. The debate underscores that profit margin is not just a dry accounting metric but a central figure in discussions about market competition, corporate responsibility, and the overall health of the Canadian economy. Monitoring these margins provides insight into whether economic growth is broadly shared or concentrated among corporate shareholders.
Frequently asked questions
What is a good profit margin for a small business in Canada?
A good profit margin depends heavily on the industry, company size, and region. For many businesses, a gross profit margin of 50 to 70 percent is considered healthy. For net profit margin, being at or above the industry average is a positive sign. Benchmarking tools can help compare your margin to peers. If your net margin is below the industry average, it may indicate opportunities to improve operational efficiency or review pricing strategies.
How do you calculate profit margin?
The basic profit margin formula is (Profit / Revenue) × 100, where profit is sales minus total expenses. For gross profit margin, calculate (Revenue, Cost of Goods Sold) / Revenue × 100. For net profit margin, use (Net Profit / Revenue) × 100, where net profit is the after-tax income. These calculations use figures from your income statement and express the result as a percentage, showing how much of each revenue dollar is retained as profit.
What is the difference between gross margin and net margin?
Gross profit margin measures profitability after deducting only the direct costs of producing goods or services, known as the cost of goods sold. It shows production efficiency. Net profit margin is the bottom-line measure that deducts all expenses from revenue, including operating costs, interest, and taxes. It reveals the true profitability of the entire business operation and is a key indicator of overall financial health.
Why are grocery store profit margins in Canada so low?
Grocery stores in Canada typically operate on low profit margins, historically averaging around 3 to 4 percent. This is characteristic of the highly competitive retail grocery industry, where a large portion of revenue, about 96 percent, goes to cover costs like wholesale food prices, labour, and store operations. While these margins doubled from a pre-pandemic average of 2.0 percent to 4.1 percent in 2023, they remain low compared to many other sectors. Profit margins are an indicator of a company's pricing strategies and how well it controls costs, and differences in competitive strategy cause the profit margin to vary among different companies.
How have Canadian corporate profit margins changed recently?
Canadian corporate profit margins increased significantly during the COVID-19 pandemic. The average pre-tax profit margin was over 12 percent in 2021 and 2022, up from a 2010 to 2019 average of 8.1 percent. In 2023, the margin remained well above pre-pandemic levels at 10.7 percent. This increase suggests corporations raised prices more than their input costs rose. However, this surge in profits did not lead to increased corporate investment in the economy during this period.
What causes a company's profit margin to decline?
A decline in profit margin can be caused by several factors. Common reasons include rising costs for materials or labour that are not offset by price increases, inefficient operations that increase expenses, and increased competition forcing lower prices. A low profit margin indicates a low margin of safety, which means there is a higher risk that a decline in sales will erase profits and result in a net loss. A detailed review of the income statement is needed to identify the specific drivers behind a margin decrease, such as inventory accumulation, under-utilized resources, or a high cost of production.
Sources and further reading
- Profit margin (Wikipedia) en.wikipedia.org
- Other miscellaneous merchant wholesalers - 4189 ised-isde.canada.ca
- Profits rise as investment stalls in Canada's affordability crisis taxfairness.ca
- Net Profit Margin Calculator bdc.ca
- Industries with the Highest Profit Margin in Canada 2026 ibisworld.com
- How to calculate profit margin | Sage Advice Canada sage.com
This article explains how things work and is not financial, tax or legal advice. Rules, limits and rates change, so check the current figures with the Canada Revenue Agency, your province or your financial institution before you act.