Free cash flow is a financial metric that measures the cash a business generates after covering its operating expenses and necessary investments in capital assets. It represents the cash available for distribution to shareholders, debt repayment, or reinvestment. In Canada, free cash flow is a key indicator used by investors, analysts, and lenders to assess a company's financial health and flexibility. Understanding free cash flow is crucial for evaluating Canadian stocks, the sustainability of dividends, and the intrinsic value of a business.
Definition and Core Concept
Free cash flow is the portion of a company's operating cash flow that exceeds its required spending on working capital and fixed assets, known as capital expenditures. It is the cash that can be extracted and distributed to creditors and securities holders without disrupting operations. This makes it a vital indicator of a company's financial flexibility. Unlike net income, free cash flow accounts for the actual cash spent on capital goods and changes in working capital, and it excludes non-cash accounting items. For Canadian investors and analysts, free cash flow offers a truer reflection of actual cash generation than metrics like net income or EBITDA, as it captures cash outflows not always covered in standard loan covenants.
Calculation Methods and Formulas
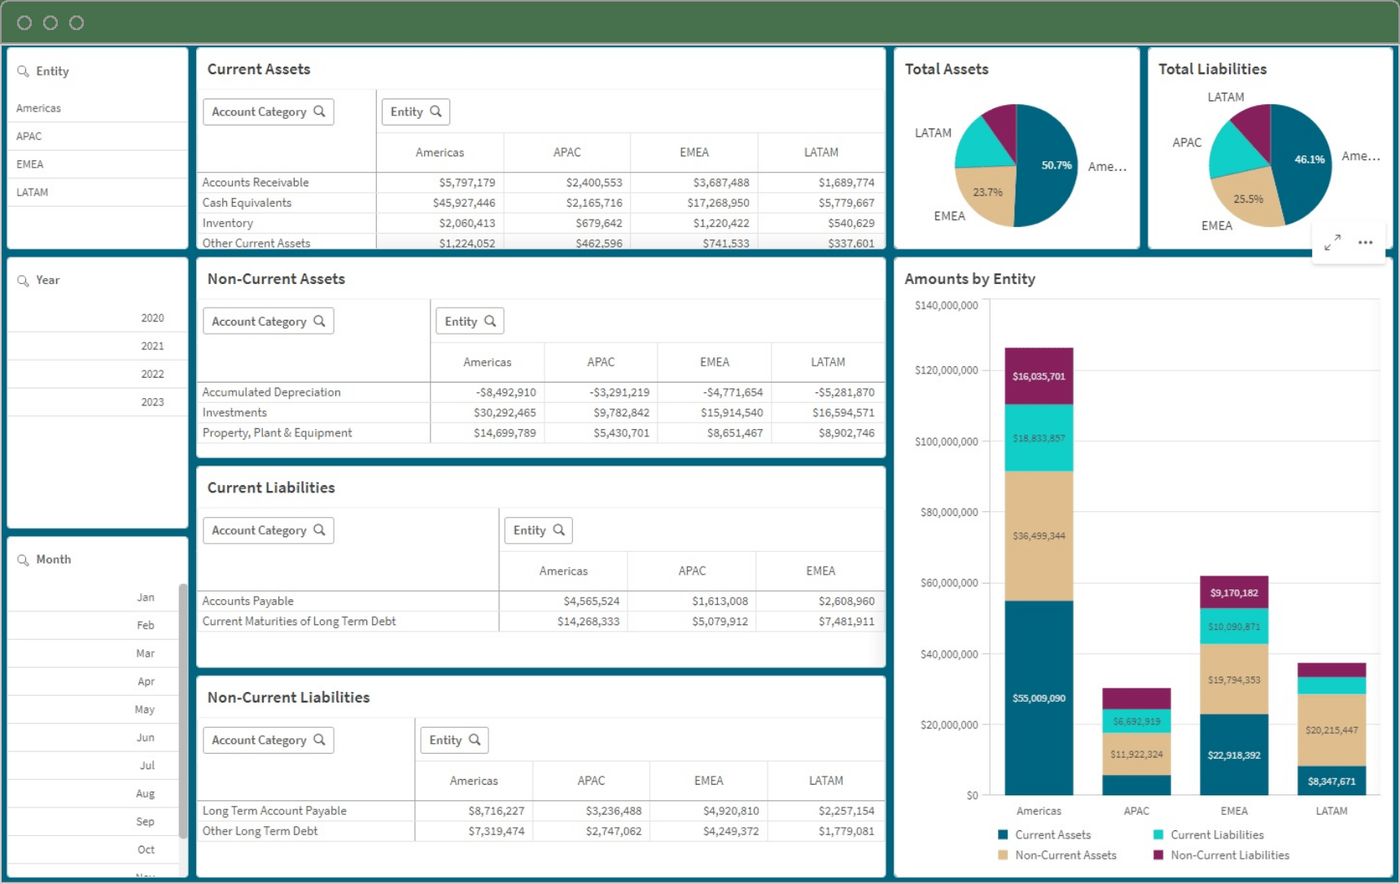
There is no single standardized formula for calculating free cash flow, as it is a non-GAAP measure. The calculation depends on the available data and the specific audience. A foundational and common method is to subtract capital expenditures from cash generated by operating activities, both figures found on the cash flow statement. An alternative approach starts with net income from the income statement and makes several adjustments. This formula adds back non-cash expenses like depreciation and amortization, and often interest and taxes, then subtracts changes in non-cash working capital and the acquisition of capital assets.
Investment bankers often compute two specific variants. Free cash flow to the firm is calculated as after-tax operating income plus non-cash charges minus capital expenditures minus working capital expenditures. Free cash flow to equity starts with net income, adds non-cash charges, subtracts capital expenditures and the change in non-cash working capital, and then adds net borrowing. The relationship between them is expressed as free cash flow to equity equals free cash flow to the firm plus net borrowing minus interest multiplied by one minus the tax rate.
- Basic Formula: Operating Cash Flow, Capital Expenditures.
- Income Statement Approach: Net Income + Depreciation/Amortization +/- Changes in Working Capital, Capital Expenditures.
- FCFF (Free Cash Flow to Firm): After-tax operating income + Non-cash charges, CAPEX, Working capital expenditures.
- FCFE (Free Cash Flow to Equity): Net income + Non-cash charges, CAPEX, Change in non-cash working capital + Net borrowing.
- Unlevered FCF: EBITDA, CAPEX, changes in net working capital, taxes.
For example, using data from a cash flow statement, a calculation might show a result of negative $3,500. This indicates the company spent more cash on operations and investments than it generated that year. The example illustrates how free cash flow can reveal cash constraints. This can happen even when a business appears profitable on paper from its net income.
Free Cash Flow Versus Net Income
Free cash flow and net income differ in two primary ways, both relating to cash timing and capital spending. The first difference is the accounting for capital goods purchases. Net income deducts depreciation expense gradually over an asset's life. Free cash flow, however, accounts for the full cash outlay for capital purchases in the period they occur. For instance, if a Canadian business buys a $50,000 truck with cash, its income statement will only show a $10,000 depreciation expense, potentially leaving net income positive. The free cash flow calculation would reflect the full $50,000 cash expenditure, revealing a potentially significant cash drain.
The second major difference is the adjustment for changes in net working capital, which includes items like accounts receivable and inventory. A growing company typically requires more cash to finance the labor and profit components embedded in increasing receivables and inventory balances, which reduces free cash flow even if net income is rising. Conversely, a company with declining sales may see its working capital needs decrease, which can add to free cash flow. Over the long term, however, decelerating sales trends will negatively impact cash generation. This makes free cash flow a more direct measure of true cash generation and a company's capacity to pay dividends or reduce debt.
Uses and Applications in Valuation
Free cash flow is used to measure the cash a company can pay to bondholders as interest and principal and to shareholders as dividends. According to the discounted cash flow valuation model, a company's intrinsic value is the present value of all its future expected free cash flows, discounted at the company's weighted average cost of capital. Many investors prefer using free cash flow over net income to measure performance and calculate value because it is considered more difficult to manipulate. In Canada, the metric is also used to evaluate the sustainability of distributions from entities like REITs, Oil and Gas Royalty Trusts, and Income Trusts through the payout ratio, which divides distributions by free cash flow.
For financial advisors and wealth managers in Canada, understanding free cash flow is vital when assessing a company's capacity to pay dividends, reduce debt, or reinvest in growth. A consistently positive free cash flow is generally a sign of financial strength and operational efficiency. Companies with high free cash flow have the fuel to fund profitable growth initiatives with internal cash or reward shareholders directly. This is the principle behind investment strategies like the Brompton Cash Flow Kings ETFs, which target companies with strong free cash flow yields. These strategies are based on the idea that free cash flow yield, unlike traditional P/E ratios, cuts through accounting noise to focus on how much cash a company generates.
Limitations and Key Debates
Despite its utility, free cash flow has several notable limitations. A primary issue is the lack of a standardized, audited calculation under International Financial Reporting Standards or GAAP. Management has discretion in disclosing what constitutes maintenance capital expenditures versus growth capital expenditures, which can lead to manipulation or require estimation. Since maintenance capex can be a large number, this uncertainty leads some analysts to dismiss free cash flow as unreliable. Capital expenditures are also intrinsically lumpy, as large, infrequent investments in long-lasting assets can cause free cash flow to vary dramatically from year to year, making it difficult to identify a normal or repeatable level.
The metric also makes assumptions that may not reflect real-world financing. It records the full cost of a capital asset in the purchase year, even if the purchase was financed with a loan paid over time. Furthermore, it disregards the common use of lines of credit to finance working capital and ignores cash injections from shareholders. Therefore, experts caution that free cash flow should only be used as part of a toolkit of ratios and not as the sole basis for an investment or lending decision. Its limitations underscore the importance of analyzing it in conjunction with other financial indicators.
Free Cash Flow in the Canadian Context
Free cash flow is a prominent metric in Canadian markets for analyzing corporate performance and guiding investment decisions. Major Canadian companies report this figure, with Royal Bank of Canada's annual free cash flow for 2025 reported at $37.82 billion. The concept is central to specific investment products available to Canadian investors, such as the suite of Brompton Cash Flow Kings ETFs. These exchange-traded funds employ a rules-based methodology to select Canadian, U.S., and international companies with high free cash flow yields, aiming to buy inexpensive companies generating strong cash flows.
The strategy is based on the premise that free cash flow is the fuel for growth and shareholder rewards. These ETFs have management fees ranging from 0.0% for the global fund to 0.55% for the international fund, and their portfolios are rebalanced quarterly or semi-annually to focus on the highest-yielding companies. Canadian investors also use free cash flow screens to identify stocks, such as looking for companies where the free cash flow yield exceeds the dividend yield, as seen with stocks like BRP Inc. and Parkland Corp. For Canadian wealth advisors, interpreting free cash flow is a key part of fundamental analysis to assess a company's real financial health and long-term value for client portfolios.
Agency Costs and Managerial Implications
The concept of free cash flow is central to the theory of agency costs in corporate finance. A seminal 1986 paper noted that substantial free cash flows allow managers to finance projects earning low returns that might not be funded by external capital markets. The paper examined the U.S. oil industry in the early 1980s, which had large cash flows. It found that instead of paying out excess resources to shareholders, management continued heavy spending on exploration and development despite returns below the cost of capital. The market reaction to exploration announcements by these firms was negative, contrasting with the positive reaction typical for research announcements in other industries.
This highlights a key risk for investors. High free cash flow can indicate financial strength, but it also presents a temptation for management to make value-destroying investments for the sake of growth or empire-building rather than returning cash to shareholders. This agency problem underscores why many investors view consistent, shareholder-friendly uses of free cash flow such as dividends, share buybacks, or prudent debt reduction as positive signals of disciplined capital allocation. The paper's findings remain relevant for analyzing Canadian resource companies and other firms with significant cash generation.
Interpreting Free Cash Flow Trends
Interpreting whether a free cash flow figure is good or bad requires context, including the company's industry, growth stage, and capital requirements. A positive free cash flow indicates a company generated more cash than it needed for operations and investments, which can be used for dividends, share buybacks, debt reduction, or new opportunities. A negative free cash flow is not automatically negative, as it can result from strategic investments for future growth, such as significant spending on new equipment or technology. However, persistent negative free cash flow over several periods may signal underlying financial challenges, indicating a company might face difficulties meeting its obligations or funding future growth if it consistently spends more than it generates.
Trends are more important than a single period. Capital-intensive industries like oil and gas, utilities, and manufacturing typically have lower or more volatile free cash flow due to large asset investments. Service and technology companies with fewer physical assets often exhibit higher and more stable free cash flow. For financial planning, the long-term trend of a company's free cash flow generation is a stronger indicator of financial position than short-term fluctuations. Analysts also use the FCF conversion ratio to assess how much of a company's EBITDA is converted into cash after accounting for capital expenditures.
Frequently asked questions
What is the free cash flow calculation?
There are several common calculations. A basic formula is Operating Cash Flow minus Capital Expenditures, using figures from the cash flow statement. Another method starts with Net Income, adds back non-cash expenses like depreciation and amortization, then subtracts changes in non-cash working capital and capital expenditures. Specific variants include Free Cash Flow to the Firm and Free Cash Flow to Equity, which adjust for interest, taxes, and borrowing.
Is free cash flow the same as profit?
No, free cash flow and profit are different. Net profit is an accounting measure that includes non-cash items and spreads the cost of capital assets over time via depreciation. Free cash flow measures actual cash generation, accounting for the full cash cost of capital purchases when they occur and changes in working capital. A company can be profitable on paper but have negative free cash flow if cash is tied up in inventory or receivables.
What is a good free cash flow?
A good free cash flow depends on context. A consistently positive figure is generally a sign of financial strength, showing surplus cash for dividends, debt repayment, or investment. A negative figure can be acceptable if it stems from strategic growth investments. The trend over time and comparison to industry peers are more important than a single number. Capital-intensive industries naturally have different benchmarks than asset-light sectors.
How is free cash flow used in Canada?
In Canada, free cash flow is used by investors and analysts to evaluate companies' financial health, dividend sustainability, and intrinsic value. It is a key metric in discounted cash flow valuations. Canadian investment products, like Brompton's Cash Flow Kings ETFs, explicitly target companies with high free cash flow yields. Major Canadian corporations, such as Royal Bank of Canada, report their annual free cash flow figures.
What are the limitations of free cash flow?
Limitations include the lack of a standardized, audited calculation, allowing for potential manipulation. Capital expenditures are lumpy, causing significant year-to-year volatility. The metric assumes full cash payment for assets, ignoring common financing methods like loans or lines of credit. It also ignores cash injections from shareholders. Therefore, it should be used alongside other financial ratios, not in isolation.
Where can I find free cash flow on financial statements?
Free cash flow is not a direct line item on financial statements. To calculate it, you gather data from the cash flow statement and income statement. The operating cash flow figure is found in the operating activities section of the cash flow statement. Capital expenditures are listed in the investing activities section. Changes in working capital components are found on the balance sheet, and net income is on the income statement.
Sources and further reading
- Free cash flow (Wikipedia) en.wikipedia.org
- What is free cash flow? bdc.ca
- Brompton Cash Flow Kings ETFs | Free Cash Flow Investing bromptongroup.com
- Free Cash Flow (FCF) - Formula, Calculation, & Uses corporatefinanceinstitute.com
- Free Cash Flow (FCF) Calculator wealthprofessional.ca
- High Free Cash Flow Canadian Stocks (2026) chartmill.com
This article explains how things work and is not financial, tax or legal advice. Rules, limits and rates change, so check the current figures with the Canada Revenue Agency, your province or your financial institution before you act.