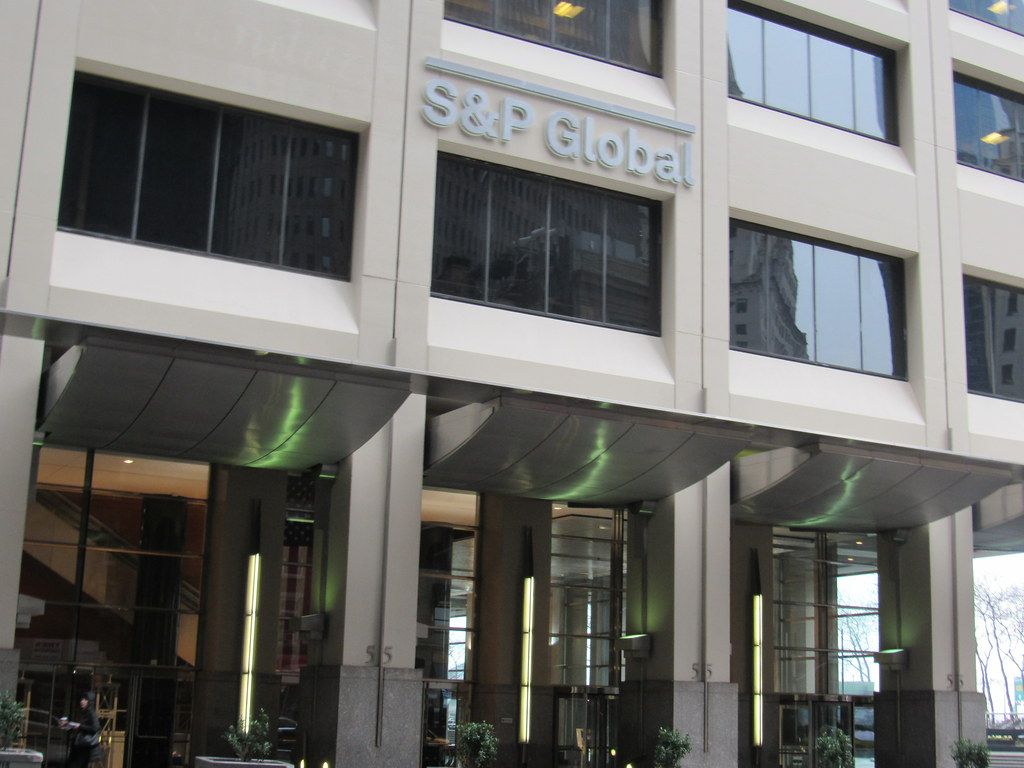
S&P Global Inc. is a leading global provider of essential financial information, analytics, and benchmarks. The company's operations, which include its world-renowned credit ratings, market intelligence, and stock indices, are deeply integrated into the fabric of global capital markets. For Canadian investors, S&P Global represents a way to gain exposure to the critical infrastructure of finance and data analytics. Its stock is widely held and trades on major exchanges, including in Canada under a ticker for Canadian investors.
Business Operations and Core Segments
S&P Global operates through five distinct business segments that provide essential services across global capital, commodity, and automotive markets. The S&P Global Ratings segment is an independent provider of credit ratings, research, and analytics, serving as one of the world's largest credit rating agencies and its most profitable segment. The S&P Global Market Intelligence segment is the company's largest segment by revenue, offering multi-asset-class data, analytics, and integrated workflow solutions to finance and corporate professionals. This segment includes several key product areas such as Desktop, a product suite for global finance professionals, data and advisory solutions for research and market data, enterprise software and workflow solutions, and credit and risk solutions that distribute the firm's ratings data. The S&P Dow Jones Indices segment maintains a wide array of valuation and index benchmarks for investment advisors, wealth managers, and institutional investors globally. The S&P Global Energy segment, which was formerly called commodity insights, provides critical information and benchmark prices for commodity and energy markets, including data from Platts. The S&P Global Mobility segment offered solutions for the entire automotive value chain, from vehicle manufacturers to finance companies, though this segment was spun off into a separate public company on July 1, 2026.
The company's operations are global in scope, with activities in the United States, the European region, Asia, and other international markets. Each segment targets specific client needs, from investors seeking credit analysis to corporations requiring benchmark data for commodities. The integration of data across these segments allows S&P Global to offer comprehensive workflow solutions that are critical to market participants. The financial performance of these segments varies, with Ratings being the leader in profitability and Market Intelligence leading in total revenue generation. This diversified business model helps stabilize the company's overall financial results across different economic cycles.
Historical Background and Evolution
The company's evolution has been marked by a strategic focus on data, analytics, and benchmarks that are fundamental to modern finance. For decades, the company's common stock traded under the ticker symbol MHP, a legacy of its history with McGraw-Hill. A significant corporate milestone occurred on April 28, 2016, when the stock began trading under its current symbol, SPGI. This change reflected the company's modernized identity and focus following the separation of its publishing assets. The company has consistently grown through organic development and strategic acquisitions, expanding its suite of offerings from traditional ratings and publishing into comprehensive data analytics, commodity insights, and indexed products.
Key dates in the company's recent corporate history include April 28, 2016, when its common stock began trading under the symbol SPGI. Prior to that, the stock had traded under the ticker MHP since the 1950s. On July 1, 2026, the company spun off its Mobility Global segment. The company was founded in 1860 and is headquartered in New York, New York.
- 1860: Company is founded.
- 1950s: Common stock begins trading under the ticker MHP.
- April 28, 2016: Stock begins trading under the current ticker symbol SPGI.
- July 1, 2026: S&P Global Mobility segment is spun off into a separate public company.
Its long operating history, dating back to 1860, has allowed it to build deep relationships and a trusted reputation within financial institutions and corporations worldwide. This has established its products, such as its credit ratings and benchmarks, as industry standards. The spinoff of the Mobility segment in 2026 represents a continued refinement of its strategic focus on core financial data and analytics markets. The company's ability to adapt over more than a century and a half demonstrates its resilience and capacity to innovate within the financial information sector. It operates through segments including S&P Global Market Intelligence, S&P Global Ratings, and S&P Dow Jones Indices.
Stock Listings and Trading Information for Canadians
S&P Global's primary listing is on the New York Stock Exchange under the ticker symbol SPGI. For Canadian investors seeking direct exposure, the stock is also available on the NEO Exchange in Canada under the ticker SPGI.NE, which is a Canadian Depositary Receipt that is Canadian dollar hedged. This provides a convenient way for investors to buy and sell the shares in Canadian dollars without needing to convert currency or trade on a US platform. Trading volume for the US-listed shares is substantial, with an average volume historically around 1.64 million shares, suggesting good liquidity for most investors.
The bid-ask spread for the stock can indicate its liquidity, where a smaller spread often suggests higher liquidity with more buyers and sellers willing to trade. Real-time bid and ask information for the stock is powered by Nasdaq Basic, a premier market data solution. Investors can use the bid-ask spread to help decide whether to place a market order or a limit order when executing a trade. The data displayed in a standard quote bar updates every three seconds, allowing for the monitoring of prices in real-time. The bid size shows the total amount of desired shares to buy at a given price, while the ask size is the number of shares offered for sale at that price.
Dividend Record and Financial Metrics
S&P Global has a established history of returning capital to shareholders through dividend payments. The company's common stock began trading under its current ticker symbol, SPGI, in April 2016, having previously traded under the MHP symbol since the 1950s. The company's financial performance is tracked through quarterly earnings reports, with earnings per share for a recent quarter reported at $4.83. S&P Global's largest segment by profitability is its Ratings business, while its largest segment by revenue is Market Intelligence, highlighting the diverse drivers of its financial results. The stock has a price to earnings ratio of 26.68 and currently yields dividends of 0.88 percent. Over the past 52 weeks, the stock has traded between a high of 525.42 dollars and a low of 363.07 dollars.
- Market Capitalization: Approximately $130.64 billion.
- Price-to-Earnings Ratio: 26.68.
- Trailing Dividend Yield: 0.8699999999999999.
- 52-Week Trading Range: Low of $360.94, High of $522.35.
- Average Trading Volume: 1.64 million shares.
- Debt to Equity Ratio: 0.5x.
The company is expected to release earnings on a quarterly schedule, with one upcoming earnings date noted as October 27, 2026. Earnings estimates are closely watched by analysts, with one estimate for an upcoming quarter at $4.43 per share. These financial metrics provide investors with tools to analyze the company's valuation, profitability, and shareholder return profile. The stock's performance is influenced by factors such as earnings reports, product launches, economic data, sector performance, and broad market conditions.
How Canadian Investors Can Hold SPGI
Canadian investors have several avenues to hold shares of S&P Global within their registered and non-registered investment accounts. The stock can be purchased directly through a brokerage account that offers access to US or Canadian markets. For those using the NEO Exchange listing (SPGI.NE), the shares are traded in Canadian dollars, which simplifies currency management. Investors can hold these shares in a Tax-Free Savings Account (TFSA) or a Registered Retirement Savings Plan (RRSP), providing tax-advantaged growth on any capital appreciation and dividend income. Many online brokerages and investment platforms allow for the purchase of fractional shares, meaning an investor does not need to buy a full share to gain exposure. Some platforms offer access to over 11,000 US-listed stocks and ETFs, which would include S&P Global.
Steps to purchase the stock through a typical platform involve creating an account with a secure and licensed trading platform. Investors must then connect a preferred funding method, such as a bank wire or debit card. Next, they can select the option to buy stocks and search for the desired stock symbol, such as SPGI, to start the purchase. Many platforms also allow investors to buy fractional shares of the stock.
- Creating an account with a licensed brokerage or trading platform and completing a secure verification process.
- Funding the account via bank wire, ACH purchase, debit card, or several other payment methods.
- Selecting the option to buy stocks and searching for the desired ticker symbol, either SPGI or SPGI.NE.
- Completing the purchase order for the desired number of shares or dollar amount on the web or mobile app.
It is important for investors to confirm with their specific financial institution about the availability of the US or Canadian listed version. They should also inquire about any associated foreign exchange fees and the rules governing holdings in registered accounts like TFSAs or RRSPs. Purchased shares will then appear in the investor's portfolio alongside other holdings like ETFs, bonds, or cash. Mobile apps from many providers allow investors to buy, sell, and manage S&P Global trades directly from a smartphone. Investors should be aware that equities may only be available to certain regions through specific apps.

Principal Risks and Considerations
Investing in S&P Global, like any equity investment, carries inherent risks that shareholders must consider. The stock exhibits market volatility, with its value capable of significant fluctuations, as evidenced by its 52-week trading range. General stock market risks include liquidity risk, where it may be difficult to buy or sell shares at a desired price, though SPGI typically has high trading volume. The company operates in a competitive and regulated industry, facing potential risks from technological disruption, changes in financial regulations affecting its ratings business, and competition from other data providers. Its performance is also tied to the health of the global capital markets. During economic downturns or periods of low financial activity, demand for its data and analytics services could decline.
Specific complex risks may also exist related to its business operations, such as litigation risk or reputational risk associated with its credit ratings. Investors should conduct thorough research to understand these risks in the context of their own investment objectives and risk tolerance. General risks applicable to all stocks, as noted, include the volatility of performance where value can drop quickly, the potential for low liquidity hindering trades, and the complexity of specific investments. Investors are cautioned not to concentrate all their capital in a single stock and to be prepared for the possibility of losing all money invested. Understanding these factors is a crucial part of making an informed investment decision.
Recent Corporate Developments and Strategy
S&P Global continues to evolve its business model and product offerings in response to market demands. A significant strategic move was the completion of the spinoff of its S&P Global Mobility segment, which includes automotive data services like Carfax, into a separate publicly traded company effective July 1, 2026. The company is actively expanding its capabilities in artificial intelligence and advanced analytics, as seen by its integration of third-party data into its platforms. For instance, S&P Global recently added Visible Alpha's detailed sell-side consensus data to its AI Data Portal, providing clients with application programming interface driven access to financial estimates and models. This focus on technology and data integration aims to enhance its workflow solutions for clients in the financial-services industry and beyond. The expansion of its AI tools, such as making Visible Alpha's consensus available through its AI Data Portal, supports client activities like earnings preparation.
The company's strategy remains centred on leveraging its entrenched market positions in ratings and benchmarks while growing its higher-margin analytics and enterprise software offerings. By providing API-driven access to detailed estimates and financial line items, the company is embedding its data directly into client workflows. These developments highlight S&P Global's ongoing transition from a traditional financial publisher to a technology-enabled data and analytics platform. This evolution is critical for maintaining its competitive edge in a sector that is increasingly driven by digital innovation and real-time data delivery. The company's actions demonstrate a clear commitment to maintaining its leadership by investing in the tools and data products that its global client base requires.
Frequently asked questions
What does S&P Global do?
S&P Global provides credit ratings, benchmarks, analytics, and workflow solutions in the global capital, commodity, and automotive markets. It operates through segments including S&P Global Ratings, which is an independent provider of credit ratings, and S&P Global Market Intelligence, which provides multi asset class data and analytics. Other segments are S&P Global Energy, S&P Global Mobility, and S&P Dow Jones Indices. The company spun off its Mobility Global segment on July 1, 2026.
What are the main risks of investing in S&P Global?
The main risks of investing in S&P Global include general stock market volatility, where the share price can rise and fall significantly. The performance of stocks can be volatile, with their value dropping as quickly as it can rise. Some stocks may also suffer from low liquidity, which could prevent buying or selling at a desired price. Specific stocks may carry complex risks that are hard to understand.
What is the ticker symbol for S&P Global stock?
The primary ticker symbol for S&P Global common stock is SPGI. The company's common stock began trading under this symbol on April 28, 2016. For Canadian investors, the stock is also available on the NEO Exchange under the symbol SPGI.NE, which represents a Canadian Depositary Receipt (CDR) that is hedged to the Canadian dollar. Prior to the 2016 change, the stock had traded under the ticker MHP since the 1950s. This provides multiple avenues for investors to gain exposure to the company's equity.
Does S&P Global pay a dividend?
Yes, S&P Global pays a dividend to its shareholders. The stock currently yields dividends of 0.88 percent. This dividend is part of the return profile for investors in the company's common stock, which trades under the symbol SPGI. The dividend yield is one factor investors consider alongside the company's price to earnings ratio of 26.68 and its overall market performance.
Can I hold S&P Global stock in my TFSA or RRSP?
Yes, Canadian investors can hold S&P Global shares in both Tax Free Savings Accounts (TFSA) and Registered Retirement Savings Plans (RRSP). This can be accomplished by purchasing the US listed shares under the ticker SPGI or the Canadian listed CDRs under SPGI.NE through a brokerage account. The availability of the CDR provides a Canadian dollar hedged option that is typically eligible for registered accounts. Investors should always confirm specific eligibility and trading rules with their own financial institution or advisor to ensure compliance.
When did S&P Global change its stock ticker to SPGI?
S&P Global's common stock began trading under its current stock symbol 'SPGI' on April 28, 2016. This change marked a rebranding from its previous long standing ticker symbol. For decades prior to this change, since the 1950s, the company's stock had traded under the ticker 'MHP'. The shift to SPGI aligned the public trading symbol with the company's modern brand identity as S&P Global Inc.
Sources and further reading
- S&P Global Inc. (SPGI.NE) Stock Price, News, Quote & ... ca.finance.yahoo.com
- S&P Global Inc. Common Stock (SPGI) nasdaq.com
- SPGI Stock Price Quote & News, S&P Global robinhood.com
- S&P Global (SPGI) Stock price today, quote & chart kraken.com
- Buy S&P Global Stock, SPGI Stock Quote Today ... - Public app public.com
This article explains how things work and is not financial, tax or legal advice. Rules, limits and rates change, so check the current figures with the Canada Revenue Agency, your province or your financial institution before you act.