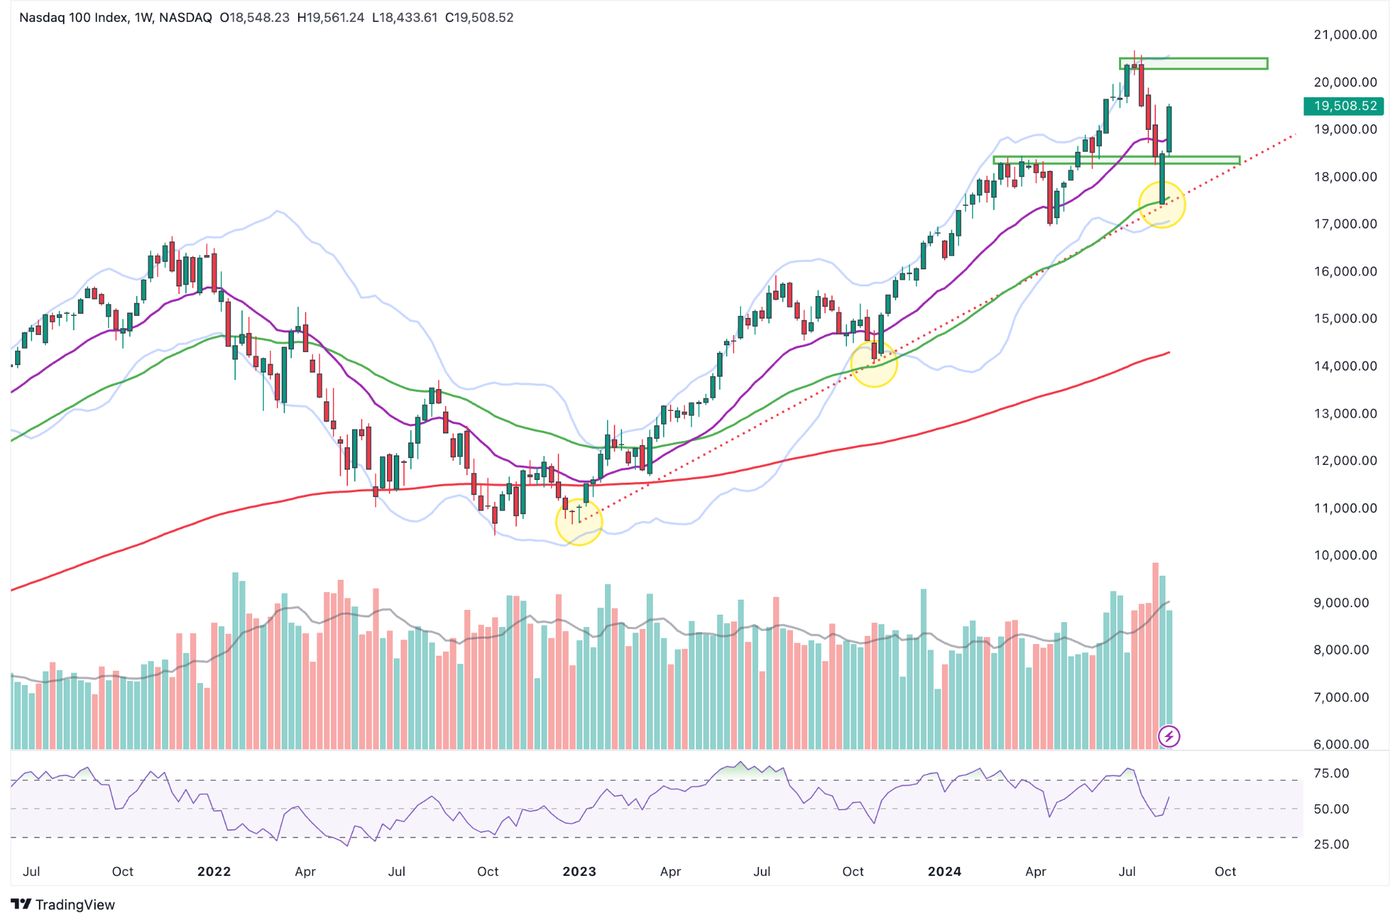
The Nasdaq-100 Index is a benchmark that tracks 100 of the largest non-financial companies listed on the Nasdaq stock exchange, heavily weighted towards technology and innovation. It serves as a key barometer for the performance of major U.S. growth stocks, including giants like Apple, Microsoft, and Nvidia. For Canadian investors, the index offers crucial diversification away from the domestic market's heavy concentration in financials and resources. Access is provided through a variety of Canadian-listed exchange-traded funds (ETFs), which can be held in registered accounts like TFSAs and RRSPs.
What the Nasdaq-100 Index Tracks and How It Is Built
The Nasdaq-100 Index is a modified market-capitalization weighted index designed to track the performance of 100 of the largest domestic and international non-financial companies listed on the Nasdaq Stock Market. The index excludes companies from the financial sector, such as banks and investment firms, which sets it apart from broader market indices. The selection and weighting of companies are primarily based on their market capitalization, though the methodology includes modifications to adjust for the influence of the largest constituents. This structure means the index is heavily influenced by its biggest members, with the top holdings often accounting for a significant portion of its total movement. The composition is reviewed annually and can be adjusted on an ad-hoc basis to reflect corporate actions like mergers or significant market shifts. The index provides a concentrated snapshot of innovation-driven sectors, with technology companies historically representing roughly half of its weight.
Benchmark exposure is to 100 of the largest U.S. and international non-financial companies listed on the NASDAQ Stock Market, offering access to some of the best-known growth companies globally. The index methodology ensures it captures leading firms in technology, consumer services, healthcare, and industrials. The modified weighting system helps prevent any single company from exerting excessive dominance, though the top ten holdings still command a large share of the total index value. This construction makes the Nasdaq-100 a distinct and focused tool for measuring the performance of the non-financial segment of the Nasdaq exchange.

History and Evolution of the Index
The Nasdaq-100 Index was launched in 1985, emerging from the Nasdaq exchange which itself began as an electronic quotation system for over-the-counter stocks. Its creation formalized a way to track the performance of the largest and most active non-financial stocks trading on that exchange. In recent years, performance has been driven by themes like cloud computing, artificial intelligence, and digital transformation, with leadership from a cohort often referred to as the Magnificent Seven. The index demonstrated robust performance in 2025, with a year-to-date return of approximately 22%, driven notably by strong corporate earnings in the semiconductor sector. This history underscores its transformation from a tech-heavy benchmark to a diversified index of large-cap growth companies that are leaders in their respective fields.
The index entered 2026 following that strong 2025 performance, which was marked by a significant shift where corporate earnings, rather than rising valuations, became the primary driver of returns. The semiconductor industry continued its dominance during this period, with leaders like Nvidia surpassing a $4 trillion market capitalization, cementing the role of hardware as the backbone of the modern economy. The index's resilience and high performance over the last decade have been driven by the rapid expansion of large-cap U.S. technology stocks, evolving from the era of the FAANG cohort into a current phase fueled by the Magnificent Seven and the global race for Artificial Intelligence supremacy. This evolution reflects the index's ability to adapt and incorporate the companies defining each successive wave of technological and economic change.
Primary Sectors and Major Holdings
The Nasdaq-100 Index offers exposure to a range of sectors, though it maintains a dominant focus on technology and innovation. Technology companies, including those in software, hardware, and semiconductors, consistently make up about 50 percent of the index's total weight. The consumer discretionary sector is another major component, represented by companies in retail, media, and automotive. The index also includes companies from the healthcare, industrial, and telecommunications sectors. The largest individual holdings are typically the world's most valuable companies, which exert considerable influence on the index's daily performance. This sector concentration provides Canadian investors with exposure that complements Canadian equities, which are heavily weighted towards financials and energy, offering clear diversification benefits.
Common top holdings found in ETFs that track the index include Apple Inc., a leader in consumer electronics and software. Microsoft Corporation, a dominant force in cloud computing and productivity software. Nvidia Corporation, a company central to semiconductor design for AI and graphics. Amazon.com Inc., the giant in e-commerce and cloud services. Meta Platforms Inc., the parent company of major social media and virtual reality platforms. Alphabet Inc., the parent company of Google and a leader in online advertising and AI research. And Tesla Inc., an innovator in electric vehicles and clean energy. These companies are central to global trends in artificial intelligence, cloud infrastructure, and digital consumer behaviour. The performance of these holdings directly shapes the index's returns, making an understanding of their businesses essential for investors. The iShares NASDAQ 100 Index ETF, for example, lists these types of companies among its popular holdings.
How Canadians Can Invest: ETFs and Trading Details
Canadian investors cannot purchase the Nasdaq-100 Index directly. Instead, they gain exposure primarily through Canadian-listed exchange-traded funds that replicate the index's performance. These ETFs are bought and sold on the Toronto Stock Exchange (TSX) like any other stock, using Canadian dollars. They are eligible for holding in all types of registered and non-registered investment accounts, including Tax-Free Savings Accounts (TFSAs) and Registered Retirement Savings Plans (RRSPs). Investors should note the trading expense ratio, which represents additional portfolio transaction costs, though it is usually a smaller figure. The primary decision for investors is choosing between currency-hedged and unhedged ETF versions, a choice that significantly impacts risk and return potential.
The following table compares key features of several prominent Canadian-listed Nasdaq-100 ETFs. The iShares NASDAQ 100 Index ETF (CAD-Hedged) (XQQ.TO) is the second-most popular Nasdaq-100 ETF in Canada, with over $4 billion in assets. BMO NASDAQ 100 Equity Hedged to CAD Index ETF (ZQQ) is another popular option, holding over $2.25 billion in assets. For unhedged exposure, investors can consider the BMO NASDAQ 100 Equity Index ETF (ZNQ) or the iShares NASDAQ 100 Index ETF (XQQU.TO), which debuted in September 2023. More complex products like the Global X Enhanced Nasdaq-100 Index ETF (QQQL) seek to provide 125 percent exposure to the index's performance using light leverage.
| ETF Name (Ticker) | Key Feature | Currency Approach | Provider |
|---|---|---|---|
| BMO NASDAQ 100 Equity Hedged ETF (ZQQ.TO) | Most popular by assets. Holds underlying stocks. | CAD-Hedged | BMO |
| iShares NASDAQ 100 Index ETF (XQQ.TO) | Over $4 billion in assets. Holds underlying stocks. | CAD-Hedged | BlackRock Canada |
| BMO NASDAQ 100 Equity Index ETF (ZNQ.TO) | Unhedged counterpart to ZQQ. | Unhedged (USD) | BMO |
| iShares NASDAQ 100 Index ETF (XQQU.TO) | Launched September 6, 2023. | Unhedged (USD) | BlackRock Canada |
| Global X Enhanced Nasdaq-100 ETF (QQQL.TO) | Seeks 125% daily exposure using leverage. | Varies | Global X |
These funds work by holding a basket of the underlying Nasdaq-100 stocks in proportions that mirror the index, a process known as replication. The difference between an ETF's return and the index's return is called tracking error, which can be positive or negative and is influenced by fees, currency hedging costs, and trading frictions. For example, the iShares NASDAQ 100 Index ETF (XQQ.TO) seeks to replicate the performance of the NASDAQ-100 Currency Hedged CAD Index, net of expenses. The BMO Nasdaq 100 Equity Index ETF (ZNQ.TO) is designed to replicate, to the extent possible, the performance of a NASDAQ listed companies index, net of expenses. Advanced products like QQQL use derivatives to obtain enhanced exposure, but these are generally riskier, costlier, and more complicated to understand.
Volume and liquidity are important considerations. Investors can review real-time volume on the Toronto Stock Exchange, consolidated prior day volume across all Canadian exchanges, and the average daily trading volume over a 12-month period. The net assets figure represents the value of all the ETF's assets less liabilities at a point in time. The legal entity identifier (LEI) is an international standard identification code for the ETF itself. When evaluating performance, the NAV chart shows historical daily net asset value per unit and identifies distributions, but it is not a performance chart and does not account for reinvestment or taxes. The Growth of 10K chart, however, represents the value of an initial $10,000 investment on a total return basis with distributions reinvested, and it does contemplate management fees and other fund expenses paid by the fund.
Dividends, Distributions, and Tax Treatment
While the Nasdaq-100 Index is known for growth, many of its constituent companies pay dividends, leading to distributions from ETFs that track it. The iShares NASDAQ 100 Index ETF (XQQ.TO), for example, reported a trailing twelve-month yield of 0.21 percent. Distributions from these ETFs can be made in cash or, in some cases, as additional units through a distribution reinvestment plan. The exact characterization of these distributions for tax purposes is determined after the fund's tax year-end. Investors receive an official tax statement from their broker detailing the type of income to report, which can include eligible dividends, foreign income, or capital gains. For distributions not paid in cash but resulting in additional units, investors must add the distribution amount to the adjusted cost base of their holdings for tax calculations. The tax treatment differs between registered accounts like TFSAs and RRSPs and non-registered accounts, with income in TFSAs being tax-free and foreign withholding taxes potentially applying in certain situations.
It is important to understand that distributions are characterized into an income type at year-end, and the total includes all distributions declared year-to-date. Distributions by the fund that are not paid in cash but result in additional units of the fund must be accounted for by investors for tax purposes by adding the distribution amount to the adjusted cost base of the units held. The exact tax treatment of the distributions for a calendar year is calculated after the fund's tax year-end, which is why the official tax statement from the broker is the definitive source. This process ensures investors correctly report income from these ETFs, which, due to their U.S. holdings, may involve different tax components than purely Canadian equity funds. The values shown for an asset’s percentage weight in fund factsheets are typically based on a vendor price, which may differ from the fund's final valuation price used for net asset value calculations.
Understanding and Managing Investment Risks
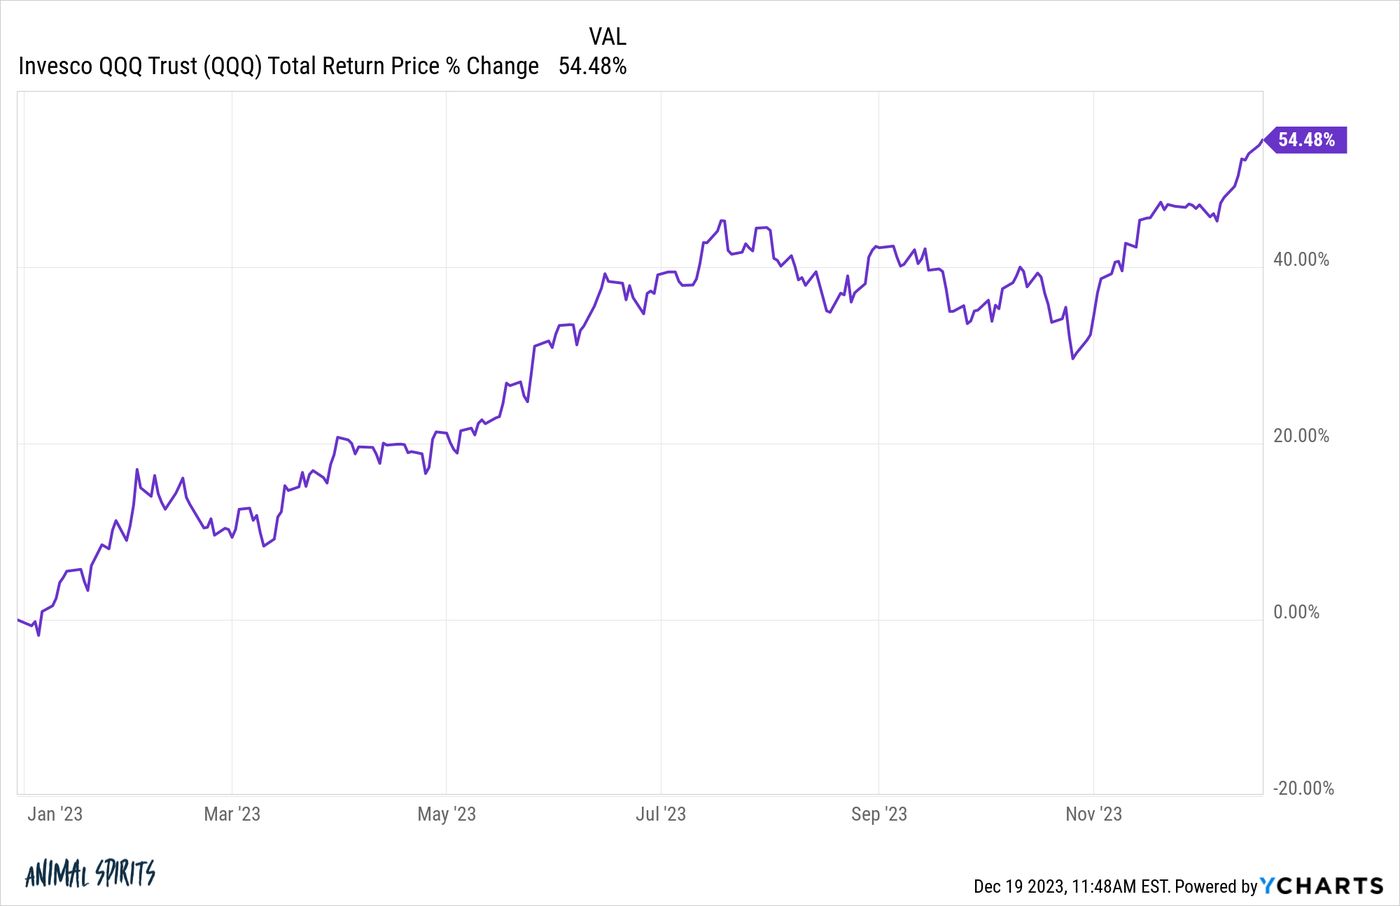
Investing in the Nasdaq-100 Index, whether directly through ETFs, carries several significant risks that Canadians must consider. The primary risk is market volatility, as the index is concentrated in growth-oriented sectors that can experience sharp price swings. ETFs tracking it are typically rated as medium to high risk based on historical return variability. Sector concentration risk is pronounced, with heavy weighting in technology making the index vulnerable to sector-specific downturns or regulatory changes. Currency risk is a major factor for unhedged ETFs, as fluctuations in the USD/CAD exchange rate can amplify or detract from returns. Hedged ETFs like XQQ or ZQQ aim to mitigate this but introduce hedging cost risk, which can lead to higher tracking errors. Leveraged ETFs, such as QQQL, which seeks 125 percent daily exposure, carry amplified risk where gains and losses are magnified and are generally unsuitable for long-term buy-and-hold strategies. Finally, all ETFs incur costs through the management expense ratio and trading expense ratio, which, over time, can erode returns relative to the index itself.
The risk rating for these ETFs is based on how much the fund's returns have changed from year to year, but it does not predict future volatility and can change over time. It is critical to remember that an ETF with a low risk rating can still lose money. For unhedged ETFs, the currency exposure means returns are influenced by changes in the USD-CAD exchange rate, whether positive or negative, leading to higher volatility. To mitigate this, hedged ETFs use forward derivatives, but they tend to incur higher tracking errors due to the cost of currency hedging. The underlying index's values are based on vendor prices, which may not reflect the fund's final valuation price for determining net asset value, a technical point that can affect reported weights. Furthermore, funds that invest in securities from markets with suspensions, such as historical cases with Russian securities, may base calculated values on the fund's own valuation price rather than a market quote. These layers of risk require careful consideration before investment.
ETF Providers and Their Specific Fund Strategies
Several major investment managers offer Nasdaq-100 index ETFs to Canadian investors, each with slightly different structures and strategies. BlackRock Canada, through its iShares brand, offers the popular XQQ (hedged) and the newer XQQU (unhedged, launched September 6, 2023). BMO Global Asset Management provides both a hedged (ZQQ) and an unhedged (ZNQ) version, with ZQQ being noted as the most popular Canadian Nasdaq-100 ETF by assets. These core ETFs are designed for long-term capital growth by replicating the index, net of expenses. Global X offers a more specialized product with its Enhanced Nasdaq-100 Index ETF (QQQL), which seeks to provide 125 percent exposure to the index's performance through the application of light leverage, resulting in potentially larger daily gains or losses. Other providers offer similar exposure through different vehicles, such as mutual funds from Scotia and institutional indexing solutions from Invesco Canada.
For instance, Scotia Funds has the Scotia Nasdaq Index Fund, Series A, a mutual fund with the objective of aggressive long-term capital growth by tracking the performance of the Nasdaq 100 Index. Invesco Canada offers institutional investment solutions, including indexing strategies, and also manages the U.S.-listed Invesco QQQ ETF, which is often referenced. The Canadian-listed equivalent for that strategy is the Invesco NASDAQ 100 Index ETF, CAD hedged (ticker: QCC). Each provider's fund will have its own management expense ratio, trading expense ratio, and specific approach to replication, whether through directly holding all underlying stocks or using a sampling methodology for very large indices. These types of ETFs have been available since 1985 and remain the primary vehicle for Canadian investors to access the Nasdaq-100, as direct investment in the index is not possible.
Frequently asked questions
What is the difference between the Nasdaq-100 Index and the Nasdaq Composite?
The Nasdaq-100 Index is a market cap weighted index that tracks 100 of the largest US non financial sector stocks listed on the NASDAQ exchange. In contrast, the Nasdaq Composite includes all common stocks listed on the Nasdaq, which numbers in the thousands and includes financial companies. The Nasdaq 100 is a concentrated benchmark heavily weighted towards technology, with around 50 percent of its composition in that sector. It debuted in 1985 and serves as a key indicator for large cap growth and technology performance.
Should I choose a hedged or unhedged Nasdaq-100 ETF in Canada?
Your choice depends on your view of currency risk. An unhedged Nasdaq 100 ETF, like BMO's ZNQ or iShares' XQQU, has higher volatility as its returns are influenced by both US stock performance and changes in the USD CAD exchange rate. A hedged ETF, like iShares' XQQ or BMO's ZQQ, uses forward derivatives to negate foreign exchange fluctuations, aiming to provide returns that reflect the underlying index performance in Canadian dollar terms. However, hedged ETFs tend to incur higher tracking errors due to the cost of currency hedging.
What is a tracking error in a Nasdaq-100 ETF?
Tracking error is the difference between the actual return of a Nasdaq 100 ETF and the return of the Nasdaq 100 Index it aims to replicate. This difference can be positive, if the ETF outperforms the index, or negative, if it underperforms. The error arises from factors including the fund's management expense ratio, trading costs, portfolio rebalancing timing, and for hedged funds, the expenses associated with currency hedging. It measures how accurately the ETF follows its benchmark.
Are there leveraged Nasdaq-100 ETFs available in Canada?
Yes, leveraged Nasdaq 100 ETFs are available in Canada, such as the Global X Enhanced Nasdaq 100 Index ETF (QQQL TO). This ETF seeks to provide 125 percent exposure to the daily performance of the Nasdaq 100 Index through the application of light leverage using derivatives. These products are generally riskier, costlier, and more complicated than standard index ETFs. They are designed for sophisticated investors and are typically suited for short term trading strategies due to the compounding effects of daily leverage.
What is the Nasdaq-100 Index?
The Nasdaq-100 Index is a market-cap weighted index that tracks the performance of 100 large-cap U.S. non-financial sector stocks listed on the NASDAQ exchange. It debuted in 1985 and currently has about 50% of its composition in U.S. technology sector stocks. The index has been a high performer, driven by large-cap technology stocks and trends like Artificial Intelligence. Investors cannot buy the index directly and must use mutual funds or ETFs that track it by holding a basket of the underlying stocks.
What are the benefits of investing in a Nasdaq-100 ETF?
The primary benefit of a Nasdaq-100 ETF is the ability to track the index accurately and at a low cost, providing exposure to leading growth companies. Since investors cannot buy the Nasdaq-100 index directly, an ETF is the best way to gain this exposure in a brokerage account. These ETFs offer diversification, especially for Canadian portfolios weighted towards financials and energy. They also provide access to global technology leaders and long-term capital growth potential through a single investment vehicle.
Sources and further reading
- iShares NASDAQ 100 Index ETF, XQQU rbcgam.com
- Top Canadian Nasdaq ETFs of 2026 fool.ca
- QQQL, Global X Enhanced Nasdaq-100 Index ETF globalx.ca
- Institutional Investors | Invesco Canada invesco.com
- The Best Nasdaq ETFs in Canada 2026 springfinancial.ca
This article explains how things work and is not financial, tax or legal advice. Rules, limits and rates change, so check the current figures with the Canada Revenue Agency, your province or your financial institution before you act.