The Hang Seng Index (HSI) is the primary market-capitalization-weighted stock market index for Hong Kong, serving as the largest indicator of overall market performance in the region. It tracks and records daily changes of major companies listed on the Hong Kong Stock Exchange. For Canadian investors, the index provides a vital window into the health of the Asian financial hub and broader Chinese economy. It can be accessed through exchange-traded funds listed in Canada, offering exposure within registered accounts like TFSAs and RRSPs.
What the Hang Seng Index Measures and Represents
The Hang Seng Index is designed to measure the performance of the largest and most liquid companies listed on the Hong Kong Stock Exchange. It is a free-float adjusted market-capitalization-weighted index, meaning the influence of each constituent company on the index's movement is proportional to its market value, adjusted for shares readily available for public trading. This methodology ensures the index reflects the investment opportunity realistically available to public market participants. The index tracks and records daily changes, providing a continuous snapshot of market sentiment and economic conditions in Hong Kong. As the largest indicator of overall market performance in Hong Kong, it is a crucial benchmark for both local and international investors. The index measures the performance of stocks traded on the Hang Seng Exchange, which is the common name for the Hong Kong stock market. Its construction aims to represent the overall market movements rather than the performance of any single sector, though certain industries may have heavier weightings at different times.
Historical Development of the Index
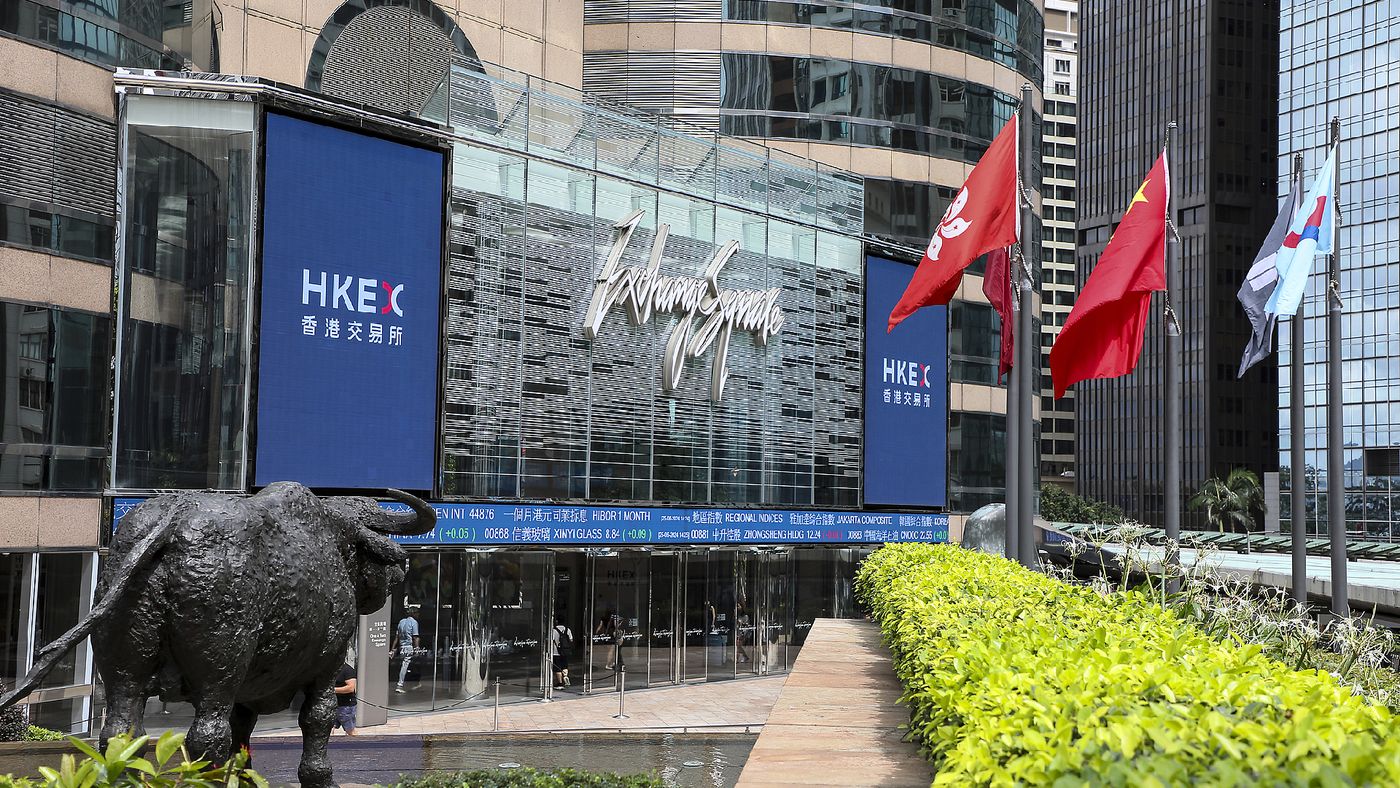
The Hang Seng Index has a long history as a barometer for Hong Kong's financial markets. It was first published on November 24, 1969, providing a standardized measure for a market that was growing in regional importance. Over the decades, the index has evolved in its composition and methodology to reflect the changing structure of Hong Kong's economy, shifting from a focus on property and finance to include more technology and consumer-oriented companies. The creation of the Hang Seng TECH Index is a more recent development, launched to specifically capture the performance of leading tech-focused firms. The main index's longevity and consistent methodology make it a trusted historical record of Hong Kong's economic trajectory. The index is maintained by Hang Seng Indexes, which provides benchmark indexes, market insights, index methodologies and educational resources supporting informed investment and research. The historical data series allows analysts to study long-term trends in one of Asia's most significant financial centres.
Composition and Major Sector Exposures
The composition of the Hang Seng Index is dynamic, but it is dominated by large-cap companies from key sectors of the Hong Kong and Chinese economies. Traditionally, the index has had significant weightings in financials, property, and telecommunications. In recent years, the influence of technology and internet companies has grown substantially. A dedicated sub-index, the Hang Seng TECH Index, explicitly captures 30 leading tech-focused companies listed in Hong Kong. These companies span industries including internet services, cloud computing, digital finance, e-commerce, semiconductors, and next-generation hardware. Many of these constituents are globally competitive, selling products like smartphones and building cloud infrastructure, which ties their growth to global demand trends alongside the domestic Chinese economy. This allows investors to access global demand trends via Chinese innovators. The tech index is designed for investors with strong conviction on the future growth of technology who wish to capture the global opportunity unfolding rapidly outside of North America.
How Canadians Can Invest in the Hang Seng Index
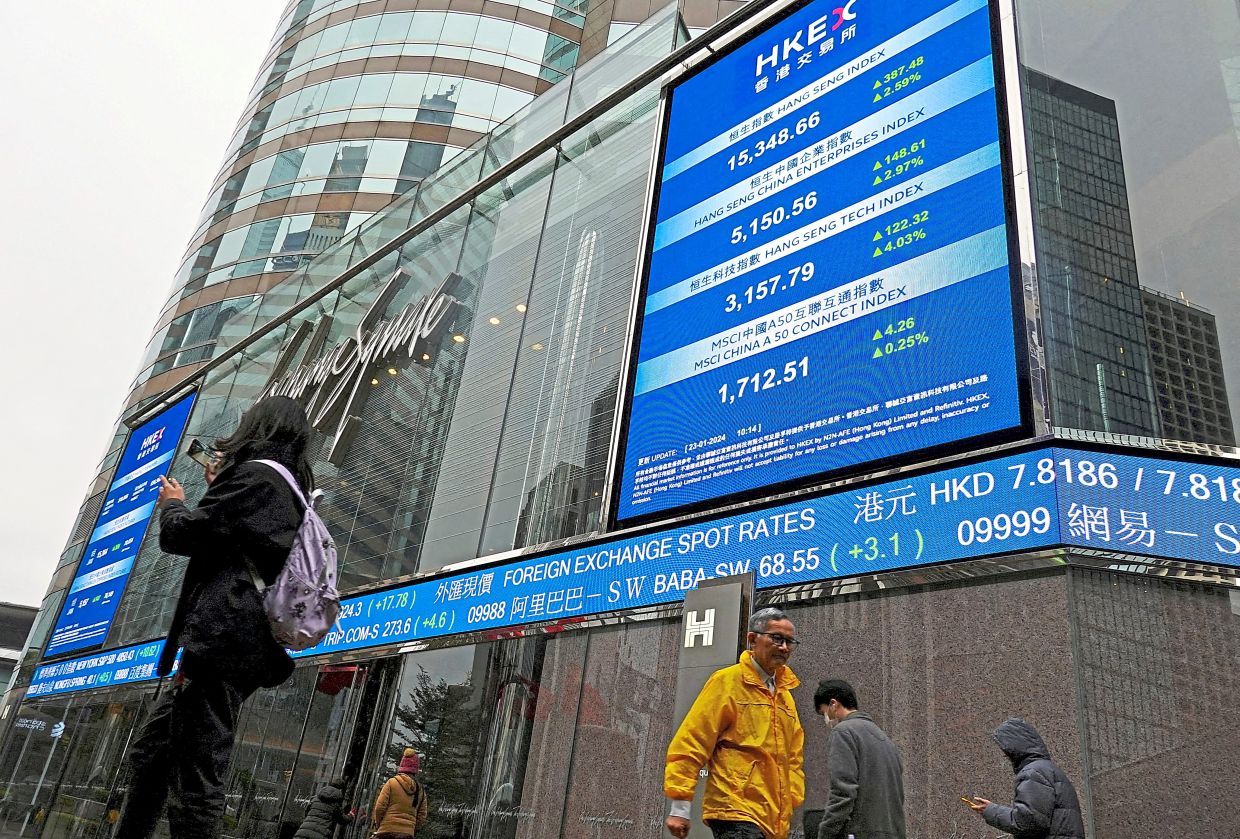
Canadian investors cannot directly purchase the Hang Seng Index itself, but they can gain exposure through exchange-traded funds (ETFs) that track its performance. These ETFs are listed on Canadian exchanges and trade in Canadian dollars, simplifying the investment process. For example, the KS Hang Seng Tech Index ETF trades on the Toronto Stock Exchange under the ticker KTEC-A. Similarly, the iShares Core Hang Seng Index ETF is available, though its primary listing is in Hong Kong under the ticker 9115.HK. These funds can be held in all types of Canadian registered and non-registered investment accounts, including Tax-Free Savings Accounts (TFSAs) and Registered Retirement Savings Plans (RRSPs). This allows for tax-advantaged growth or deferred taxation on any investment returns. Other products like the Global X China Hang Seng TECH Index ETF, ticker CHQQ, also provide targeted exposure. Investors should note that real-time volume data displayed on Canadian financial portals may only reflect trading on the Toronto Stock Exchange and not global volume.
Understanding ETF Costs, Structure, and Metrics
Investing via an ETF involves specific costs and structural details that investors should understand. The management expense ratio (MER) is a key metric, representing the total annual expenses expressed as a percentage of the fund's daily average net asset value. For the iShares Core Hang Seng Index ETF, the net expense ratio is 0.09%. The trading expense ratio (TER) covers total commissions and other portfolio transaction costs incurred by the ETF, also expressed as an annualized percentage of daily average net asset value. The net asset value (NAV) is the per-share value of all the ETF's assets minus its liabilities, calculated daily. ETFs also have a legal entity identifier (LEI), an international standard code for accurate identification of legal entities. The 12-month trailing yield shows the income distributions an investor would have received if they had held the ETF over the last twelve months, stated as a percentage of the net asset value per unit at the most recent month end.
- Management Expense Ratio (MER): Annual cost including investment manager compensation, service fees, and marketing, e.g., 0.09%.
- Trading Expense Ratio (TER): Annualized cost of portfolio commissions and transaction costs.
- Net Asset Value (NAV): Daily value of all fund assets less all liabilities.
- Legal Entity Identifier (LEI): Standardized global identification code for the ETF as a legal entity.
- 12-Month Trailing Yield: Historical income yield based on distributions over the past year.
- Net Assets: The total value of all the ETF's assets minus all liabilities at a point in time.
The NAV chart shows the historical daily net asset value per unit of an ETF. It identifies the various distributions made by the ETF, if any. These distributions are not treated as reinvested. The chart does not account for sales, redemption, distribution, or optional charges. It also does not account for income taxes payable by any security holder. The chart is not a performance chart and is not indicative of future NAV values.

Principal Risks for Investors
Investing in the Hang Seng Index, particularly through thematic ETFs like those focusing on technology, carries several inherent risks. The risk rating of an ETF is based on how much the ETF's returns have changed from year to year, but it does not tell you how volatile the ETF will be in the future. The rating can change over time, and an ETF with a low risk rating can still lose money. The underlying index is concentrated in Hong Kong and China, exposing investors to regional political, regulatory, and economic risks. Currency fluctuations between the Canadian dollar, Hong Kong dollar, and Chinese yuan can also affect returns. Furthermore, technology-focused indices can be more volatile due to rapid innovation, competitive pressures, and shifting regulatory landscapes, especially within China's digital sectors. The Global X Funds, which include some Hang Seng TECH ETFs, are not guaranteed, their values change frequently and past performance may not be repeated. Certain funds may employ leveraged investment techniques that magnify gains and losses, resulting in greater volatility and exposure to aggressive investment risk and price volatility risk as described in the prospectus.
The Hang Seng TECH Index Sub-Set
The Hang Seng TECH Index is a distinct but related benchmark that zeroes in on the technology sector. It is designed to capture the 30 leading tech-focused companies listed in Hong Kong. This index provides targeted exposure to companies driving China's digital transformation across internet, cloud, digital finance, e-commerce, semiconductors, and hardware. For investors with a specific conviction about technological growth in Asia, this index offers a way to capture that global opportunity unfolding outside of North America. ETFs tracking this index, such as the Global X China Hang Seng TECH Index ETF (CHQQ) or the KS Hang Seng Tech Index ETF (KTEC-A), allow Canadian investors to add this specific exposure to their portfolios. The performance of this sub-index can diverge significantly from the broader Hang Seng Index based on sector-specific trends. The constituents are described as globally competitive, selling smartphones, building cloud infrastructure, and powering digital payments, with growth not solely tied to the domestic Chinese economy.
Performance Data, Regulations, and Fund Details
When evaluating ETFs that track the Hang Seng Index, investors will encounter specific performance charts and regulatory disclosures. A NAV chart shows the historical daily net asset value per unit and identifies distributions, but it does not assume reinvestment of those distributions or account for taxes or sales charges. Another chart illustrates the value of an initial investment of $10,000 since the ETF's inception on a total return basis, with distributions treated as reinvested, though it also excludes taxes and sales charges. This chart is not a performance chart and is not indicative of future value. Canadian investment fund regulations restrict the presentation of performance figures until a fund reaches its one-year anniversary. All performance charts are based on historical data and are not indicative of future results, which will vary. Commissions, management fees, and expenses are all associated with an investment in these funds. The funds are not covered by the Canada Deposit Insurance Corporation, the Federal Deposit Insurance Corporation, or any other government deposit insurer, and there is no assurance a money market fund will maintain its constant net asset value.
| Chart Type | Key Limitations |
|---|---|
| NAV Chart | Distributions not reinvested. Excludes taxes, redemption, sales charges |
| Growth of $10K Chart | Assumes reinvestment of distributions. Excludes taxes and sales charges |
| Performance Data | Not published until fund is 1 year old. Past performance may not be repeated |
| Fund Guarantees | Not covered by CDIC or FDIC. Values change frequently. No guarantee of constant NAV |
The prospectus contains important detailed information on all associated risks and costs. The Global X Money Market Funds are not covered by the Canada Deposit Insurance Corporation. They are also not covered by the Federal Deposit Insurance Corporation or any other government deposit insurer. There can be no assurances that the money market fund will be able to maintain its net asset value per security at a constant amount. There is also no assurance that the full amount of your investment will be returned to you.
Trading and Liquidity Considerations
For Canadian investors trading Hang Seng Index ETFs, understanding trading metrics is important. The consolidated prior day volume refers to the ETF's aggregate volume traded on all Canadian exchanges. The average daily trading volume over a 12-month period is the ETF's aggregate average daily trading volume over that timeframe traded on all Canadian exchanges. These figures help gauge the liquidity of the ETF on domestic markets, which can impact the ease of buying and selling shares. It is important to distinguish this from the liquidity of the underlying Hong Kong stocks, which trade on a different exchange in a different time zone. The live price of the Hang Seng Index itself is a key driver for the value of these ETFs, and it can be tracked through various financial data providers. Trading the index via derivatives like CFDs is a separate activity typically not suited for long-term investment in registered accounts and carries its own distinct risks, including leverage. The ETF Database staff allocates each ETF and each index to a single best-fit ETF Database Category, with the Hang Seng Index ETFs typically falling under categories like China Equities.
Frequently asked questions
What is the Hang Seng Index?
The Hang Seng Index (HSI) is a market capitalization weighted stock market index in Hong Kong. It is adjusted for free float. It tracks and records daily changes. It was first published on the 24th of November 1969. It is the largest indicator of overall market performance in Hong Kong.
How can I buy the Hang Seng Index in Canada?
Canadian investors can buy ETFs that track the Hang Seng Index. The KS Hang Seng Tech Index ETF (KTEC-A) is one such option. The Global X China Hang Seng TECH Index ETF (CHQQ) is another option. These ETFs can be held in all registered and non registered investment accounts.
What is the difference between the HSI and the Hang Seng TECH Index?
The Hang Seng Index measures the performance of stocks traded on the Hang Seng Exchange. The Hang Seng TECH Index captures 30 leading tech focused companies listed in Hong Kong. These companies span internet, cloud, digital finance, e commerce, semiconductors, and next gen hardware. The TECH Index offers access to companies driving China's digital transformation.
What are the fees for investing in a Hang Seng Index ETF?
Fees are primarily captured by the management expense ratio (MER), which includes investment manager compensation, service fees, and marketing. For example, the iShares Core Hang Seng Index ETF has a net expense ratio of 0.09%. Investors should also consider the trading expense ratio (TER) for internal transaction costs. Commissions to buy or sell the ETF units through a brokerage are separate and not included in the MER.
Is investing in the Hang Seng Index risky?
Yes, investing involves several risks. These include market volatility, concentration risk in Hong Kong and Chinese equities, currency exchange risk, and specific regulatory risks in the technology sector. An ETF's risk rating is based on historical year-to-year return variability and can change. Even a low-rated fund can lose money. Thematic tech ETFs may use leverage, magnifying gains and losses, and are not guaranteed by any government deposit insurer.
Does the Hang Seng Index pay dividends?
The index itself does not pay dividends. However, the underlying companies within the index may pay dividends, and ETFs that track the index will collect these dividends and distribute them to unitholders. The 12-month trailing yield metric indicates the historical income distributions an investor would have received over the past year as a percentage of the ETF's net asset value. Distributions are not guaranteed and will vary.
Sources and further reading
- CHQQ, Global X China Hang Seng TECH Index ETF globalx.ca
- Hang Seng Composite Index, ETF Tracker etfdb.com
This article explains how things work and is not financial, tax or legal advice. Rules, limits and rates change, so check the current figures with the Canada Revenue Agency, your province or your financial institution before you act.