TSX top gainers and losers are lists of stocks on the Toronto Stock Exchange that have experienced the largest percentage price increases and decreases during a trading session. These lists are updated in real-time throughout the trading day and provide a snapshot of market momentum and investor sentiment. For Canadian investors, monitoring these movers helps identify trends, sector rotations, and potential volatility in the market. Understanding how these lists are compiled and what they represent is fundamental to following Canadian equity markets.
What Are TSX Top Gainers and Losers Lists
TSX top gainers and losers are dynamic rankings published by market data providers like TMX Money. These lists sort all securities trading on the Toronto Stock Exchange based on their percentage price change from the previous day's closing price. The top gainers list shows the stocks with the largest positive percentage change, while the top losers list shows those with the largest negative percentage change. These rankings are distinct from lists based on absolute dollar change, which highlight the biggest monetary moves regardless of the stock's price level. The data is typically delayed by at least 15 minutes from real-time trading activity. Investors use these lists to quickly gauge which companies are driving market action on any given day.
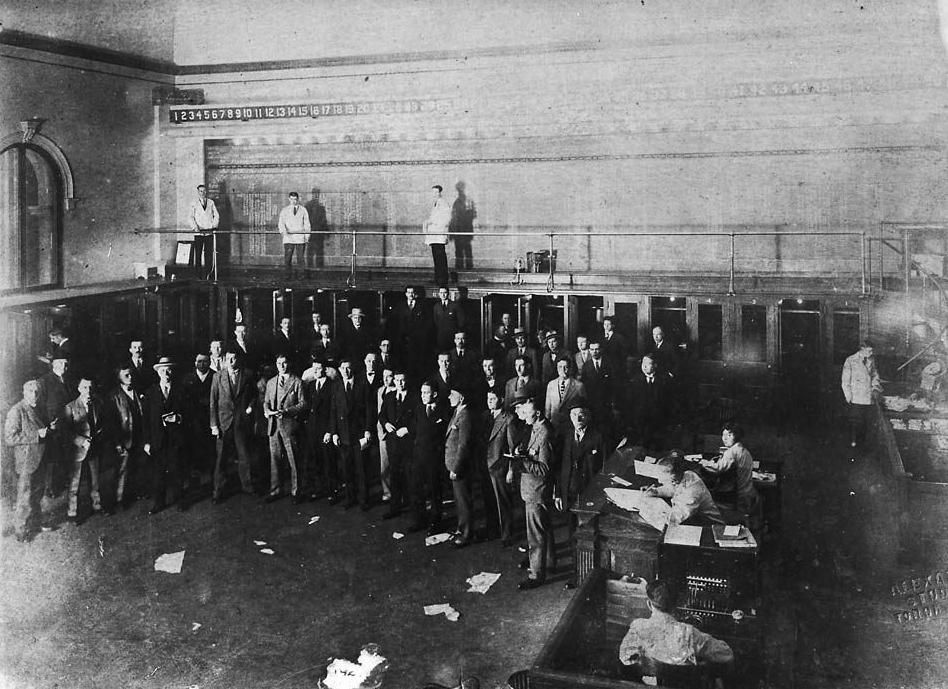
Where to Find Real-Time Market Movers
Canadian investors can access TSX top gainers and losers lists through several financial portals and the official exchange website. TMX Money provides a comprehensive Canadian stock market summary that includes these lists. The platform offers free real-time stock prices for the TSX today alongside premium investor tools for deeper research. The lists are updated continuously during market hours, with timestamps indicating the last update, such as October 21, 2026 at 10:15 ET. Other financial data services and brokerage platforms also feature these rankings, often allowing users to filter by exchange, including the TSX Venture Exchange (TSXV), the Canadian Securities Exchange (CSE), and the NEX Board. For a broader perspective, many sites also display comparable lists for major US markets like the NYSE and NASDAQ.
The major financial data platforms that provide these lists cover a wide range of exchanges beyond the main TSX. These platforms track top percentage gainers and losers for markets such as the TSX Venture Exchange (TSXV), the NEX Board, and the Canadian Securities Exchange (CSE). They also cover US markets including the NYSE, NASDAQ, and NYSE MKT. Additionally, lists are provided for the Cboe Canada exchange and the OTC market. This comprehensive coverage is available from a single source for investor convenience.
- TSX Venture (TSXV)
- NEX Board
- Canadian Securities Exchange (CSE)
- Cboe
- NYSE MKT
- NASDAQ
- NYSE
- OTC markets
This breadth allows investors to compare activity across different market tiers and geographies from a single source. For instance, an investor can view lists for the main Toronto Stock Exchange alongside those for the junior TSX Venture Exchange. They can also compare Canadian market movers with top gainers and losers on major US exchanges like the NYSE and NASDAQ. This consolidated view supports analysis of broader North American market trends. Access to these varied lists is typically provided on financial data portals.
Key Metrics Displayed in the Lists
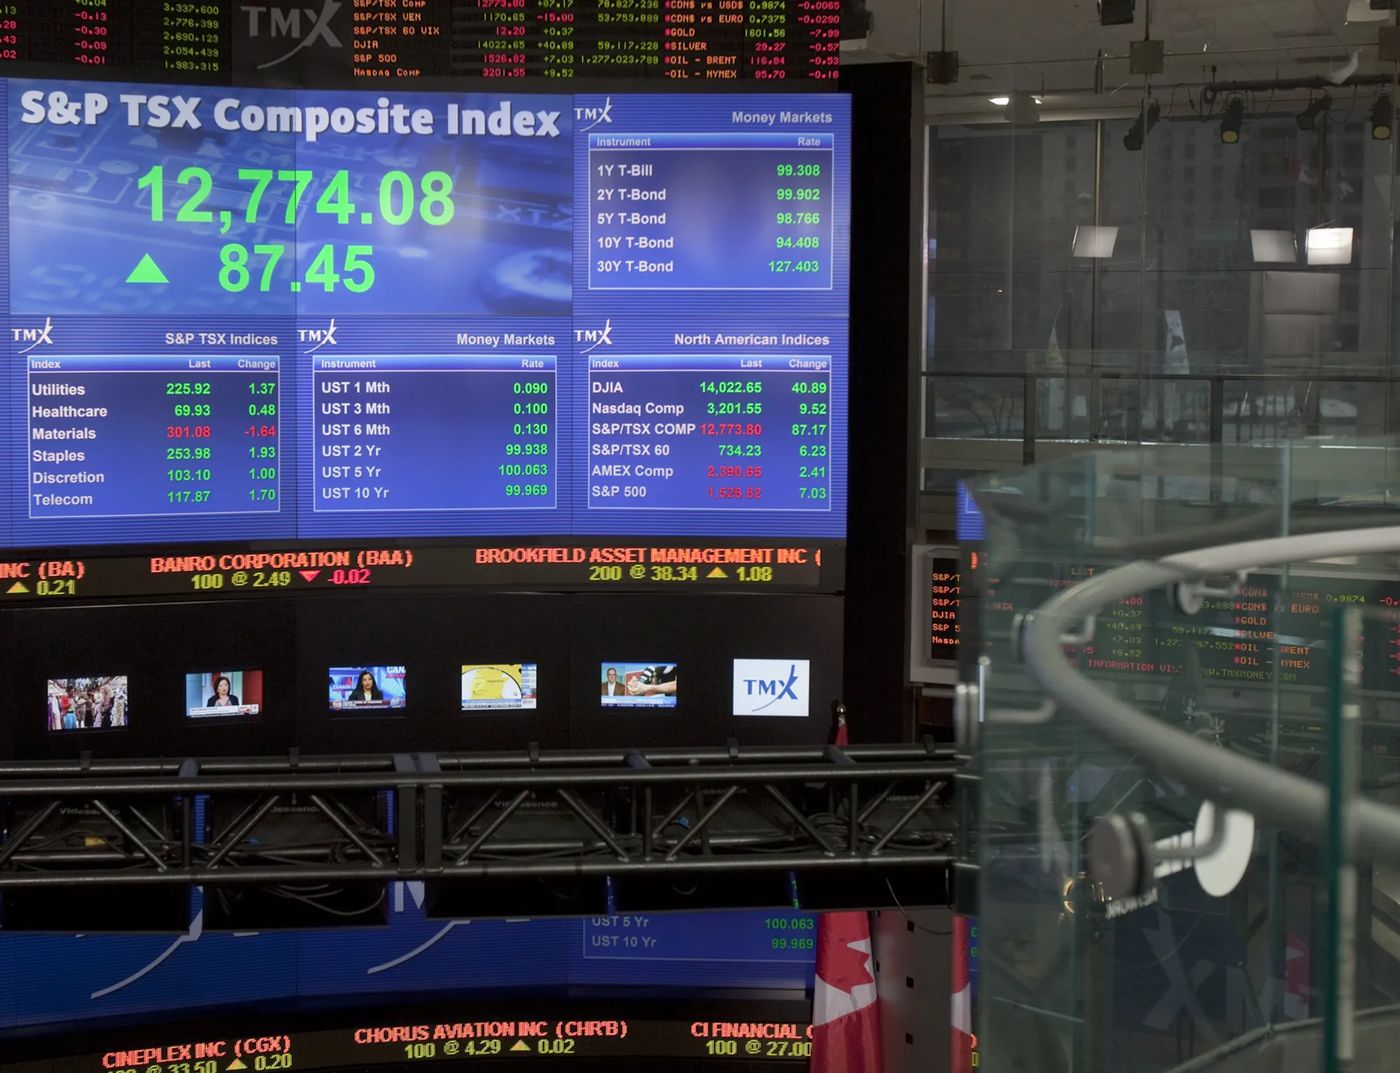
Each entry in a TSX top gainers or losers list presents a standardized set of financial data points. The primary identifier is the company's stock symbol, such as BB for BlackBerry Limited or SHOP for Shopify Inc. The company's full name is listed beside the symbol. The last traded price is shown in Canadian dollars, for example 12.45 CAD for BlackBerry on a specific date. The change column displays the absolute price move, which could be +0.91 or -0.02. The most critical column is the percentage change, which calculates the day's move relative to the prior close, displayed as +7.89% or -0.71%. Finally, the trading volume indicates how many shares have changed hands, shown as 4,293K or 302K, providing context on the liquidity and interest behind the price move. These data points together give a complete picture of the stock's trading activity for the session.
Different Types of Market Mover Rankings
Beyond the basic percentage gainers and losers, market data platforms categorize movers in several ways to provide different insights. Dollar gainers and dollar losers lists rank stocks by the largest absolute price change in Canadian dollars, which often features higher-priced stocks. The most active lists rank securities by trading volume, highlighting stocks with the heaviest buying and selling activity regardless of price direction. Additionally, tools like 52-week highs and 52-week lows lists show stocks touching their annual price extremes, which can indicate breakout or breakdown patterns. Some screeners and analysis tools allow investors to filter gainers and losers over different time frames, such as three-month periods, to identify longer-term trends beyond daily volatility.
Investors can access several distinct ranking lists on platforms like TMX Money to analyze market behaviour from different angles. Common categories include lists for top percentage gainers and top percentage losers. Platforms also provide lists for dollar gainers and dollar losers to track absolute price changes. Other available lists highlight stocks hitting 52 week highs or 52 week lows. Additional categories often include most active stocks by trading volume. These tools help investors research their next investment on exchanges like the TSX, TSXV, or Alpha.
- Percent Gainers
- Percent Losers
- Dollar Gainers
- Dollar Losers
- 52 Week Highs
- 52 Week Lows
- Most Active stocks by volume
Each list serves a specific analytical purpose, from spotting short-term momentum to identifying stocks making significant long-term price moves. For example, percentage gainer lists highlight stocks with the largest relative price increases, which can indicate short-term momentum. Dollar gainer lists identify stocks with the largest absolute price increases in Canadian dollars. A market summary for a session might show 250 gainers, 361 losers, and 12 unchanged stocks, quantifying overall market breadth. Lists for 52 week highs and lows help identify stocks making significant long-term price moves.
Examples of Recent TSX Market Movers
Reviewing specific examples from recent data illustrates the nature of stocks that appear on these lists. On October 21, 2026, notable TSX percentage gainers included Bengal Energy Ltd., which was up 20.00 percent, and Supermicro CDR (CAD Hedged), which gained 12.08 percent. Other significant gainers that day were Lucara Diamond Corp. and SpaceX CDR (CAD Hedged). Conversely, on October 20, 2026, HIVE Digital Technologies Ltd. appeared as a loser, declining 0.71 percent. Lists from other Canadian exchanges showed different movers, such as TAG Oil Ltd. and K2 Gold Corporation on the TSX Venture. These examples show that gainers and losers can come from diverse sectors including technology, energy, mining, and consumer goods.
Specific stocks that were identified as top percentage gainers on the TSX on October 21, 2026, provide concrete examples of market activity. On that date, Bengal Energy Ltd. was a top gainer, increasing by 20.00 percent to 0.03 CAD. Supermicro CDR (CAD Hedged) rose 12.08 percent to 11.69 CAD. SpaceX CDR (CAD Hedged) increased by 11.07 percent to 27.30 CAD.
- Bengal Energy Ltd. (BNG) with a +20.00% change
- Supermicro CDR (CAD Hedged) (SMCI) with a +12.08% change
- Lucara Diamond Corp. (LUC) with a +8.33% change
- SpaceX CDR (CAD Hedged) (SPCX) with a +11.07% change
- Blossom Gold Inc. (BGAU) with a +5.26% change
- BlackBerry Limited (BB) with a +4.10% change
How These Lists Reflect Market Sentiment
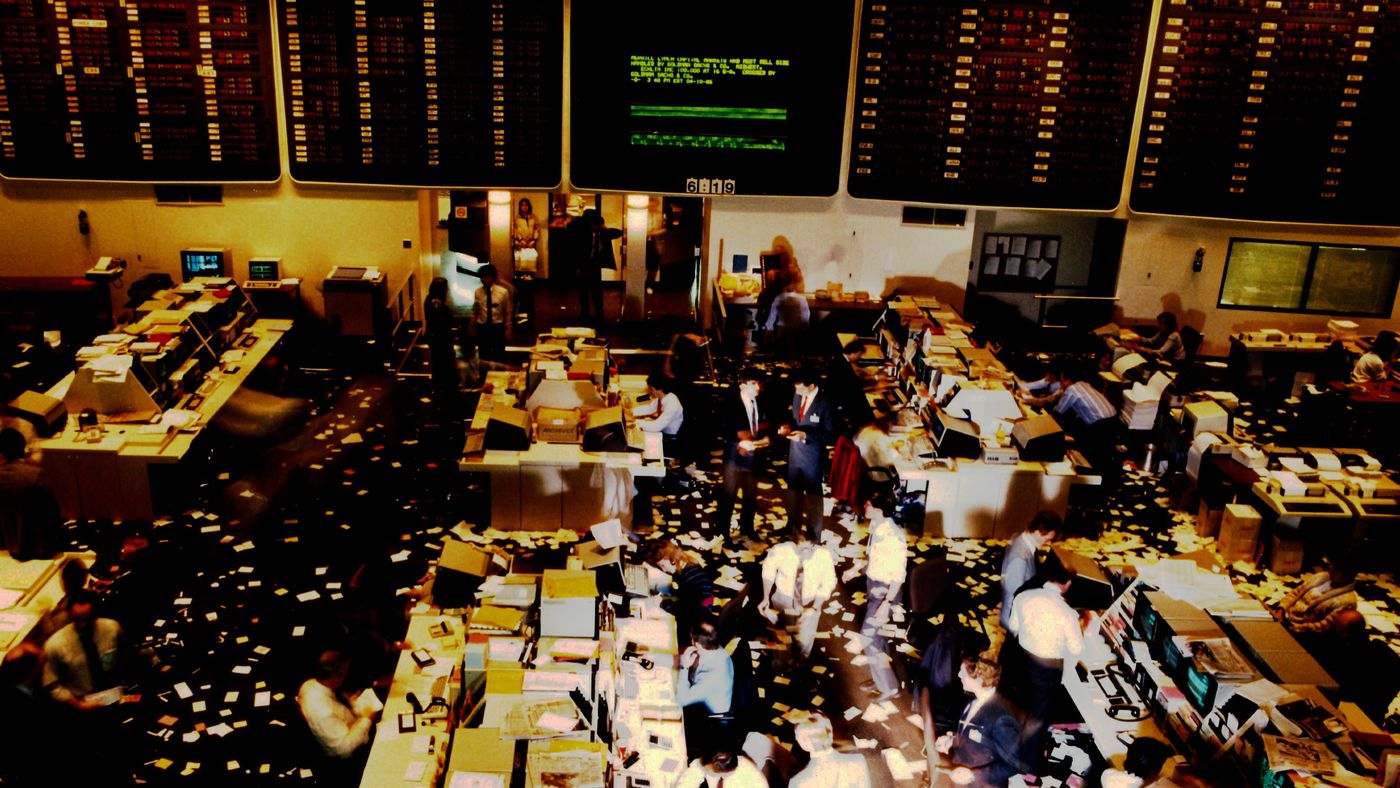
The composition of the top gainers and losers lists provides a direct window into overall market sentiment and sector-specific trends. A session with a high number of significant gainers and few losers suggests bullish, positive sentiment among investors. Conversely, a day dominated by many large percentage declines indicates bearish, negative sentiment. Analysts often look at the breadth of the market by comparing the number of gainers to losers. For instance, one session showed 250 gainers representing 40 percent of movers, 361 losers representing 57 percent, and only 12 unchanged stocks at 1 percent, indicating a negative session. Sector concentration on the lists can also signal where money is flowing into or out of, such as a cluster of gold mining stocks or technology companies. This data helps investors understand the underlying forces moving the market beyond just the index level.
Common Factors Behind Extreme Price Moves
Stocks typically land on the extreme ends of the gainers and losers lists due to specific catalysts that trigger high-volume trading. Company-specific news is a primary driver, including earnings reports that beat or miss analyst expectations, major contract announcements, management changes, or significant product developments. Sector-wide news can also move groups of stocks, such as changes in commodity prices affecting mining and energy companies or interest rate decisions impacting financial stocks. Market rumours and analyst upgrades or downgrades frequently cause sharp price movements. For smaller companies on exchanges like the TSXV, even modest trading volume can result in large percentage swings due to lower liquidity and market capitalization. Understanding these catalysts is essential for interpreting why a stock appears on a list and assessing the sustainability of the move.
Using Gainers and Losers Data in Research
While the lists are useful for spotting activity, they are starting points for research rather than direct investment signals. A stock appearing as a top gainer does not explain why it moved or whether the trend will continue. Investors should investigate the fundamental reason behind the price change by reviewing company news releases and financial statements. Checking the trading volume is crucial to determine if the move was supported by significant investor interest or was a low-volume anomaly. Comparing the percentage change to the stock's historical volatility provides context on whether the move is unusual. Integrating this data with other tools on platforms like TMX Money, such as charts and fundamental screens, creates a more complete picture for informed market analysis. This disciplined approach helps separate meaningful trends from short-term noise.
Frequently asked questions
Where can I find the TSX top gainers list for free?
You can find free real-time TSX top gainers lists on the TMX Money website, which is the official source for Toronto Stock Exchange data. The site provides continuously updated rankings of percentage gainers, dollar gainers, and most active stocks. Many other Canadian financial news portals and brokerage platforms also offer this data at no cost. The lists are delayed by at least 15 minutes from live trading during market hours.
What is the difference between percentage gainers and dollar gainers?
Percentage gainers rank stocks by their largest price increase expressed as a percentage of their previous closing price. This highlights relative movement and often features lower-priced stocks. Dollar gainers rank stocks by the largest absolute price increase in Canadian dollars. This tends to spotlight higher-priced equities.
How often are the TSX top gainers and losers updated?
The lists are updated in real-time throughout the trading day as new transactions occur and prices change. Data providers like TMX Money refresh their displays continuously. A timestamp indicates the last update, such as 'Last updated: Oct 21, 2026 10:15 ET'. It is important to note that the prices shown have a minimum delay of 15 minutes from the actual live market price. This delay is due to exchange data policies.
Do these lists include stocks from the TSX Venture Exchange?
The primary TSX top gainers and losers lists typically include only securities listed on the main Toronto Stock Exchange. However, most financial data platforms provide separate, distinct lists for the TSX Venture Exchange (TSXV). They also provide lists for the Canadian Securities Exchange (CSE) and the NEX Board. These lists function the same way, ranking the largest percentage movers on their respective exchanges. They are often accessible from the same market summary pages.
Can I see US market gainers and losers on Canadian sites?
Yes, many Canadian financial portals that feature TSX data also provide parallel lists for major US markets. It is common to see sections for NYSE and NASDAQ top percentage gainers and losers alongside the TSX information. This allows Canadian investors to monitor momentum across North American exchanges from a single platform. This provides a broader view of market trends and sentiment.
Why does a stock's high percentage gain sometimes involve a small price change?
A stock can show a very high percentage gain from a very small absolute price change if its starting price is low. For instance, a stock trading at $0.05 that increases by $0.01 has risen by 20 percent. This often occurs with low-priced, speculative stocks on junior exchanges like the TSXV, where price volatility is higher and smaller monetary moves translate into large percentage swings. This highlights why reviewing both the percentage change and the actual price is important.
Sources and further reading
- TSX, Toronto Stock Exchange investcom.com
This article explains how things work and is not financial, tax or legal advice. Rules, limits and rates change, so check the current figures with the Canada Revenue Agency, your province or your financial institution before you act.