Top stock gainers today are Canadian-listed shares that have increased the most in price during the current trading session. These lists are dynamic, changing throughout the day as market sentiment shifts and new information is priced in. For Canadian investors, monitoring these gainers provides a real-time snapshot of market momentum and can highlight sectors or specific companies attracting significant buying interest. Understanding these movements is a fundamental aspect of tracking market activity and investor behaviour.
What Are Top Stock Gainers Lists
Top stock gainers lists rank publicly traded companies by their percentage price increase over a specific period, most commonly the current trading day. These lists are compiled and published by financial data providers and the exchanges themselves, such as TMX Money for the Toronto Stock Exchange. The primary metric is the percentage change, which allows for a fair comparison between high-priced and low-priced stocks. These lists are a core feature of market data screens, helping investors quickly identify which securities are experiencing the strongest upward momentum. The composition of these lists can change rapidly as trading volumes and news flow impact different sectors.

Where to Find Canadian Top Gainers
Canadian investors have several reliable sources for accessing top gainers lists. The most authoritative source is the TMX Money website, which provides official data for the Toronto Stock Exchange and TSX Venture Exchange under sections like TSX Today and Market Movers. Financial portals and brokerage platforms also feature these lists, often with customisable filters for different exchanges or time frames. Common lists include Top % Gainers, Top % Losers, and Most Active by volume, providing a rounded view of daily market action. It is important to note that real-time data is typically delayed by at least 15 minutes for non-professional users. These sources update continuously during market hours, reflecting the latest trades and price movements across all listed securities.
Major financial data platforms categorize these lists by the specific exchange they cover. The primary sources for Canadian-focused lists include the TMX Money website and various stock screeners. These sources provide lists for markets such as the TSX and the TSX Venture Exchange. They allow investors to track top performers specific to each trading venue. This categorization helps in comparing stocks within the same regulatory and liquidity environment.
- TMX Money for TSX and TSX Venture Exchange data.
- TSX Venture Exchange for its own listed companies.
- Canadian Securities Exchange (CSE) for its listed companies.
- Platforms like ADVFN which provide TSX Market Movers data.
- Screener tools that list Day Gainers for Canada.
- Data feeds covering US markets like NASDAQ and NYSE for broader context.
Each platform offers slightly different presentations, but all centre on the key metrics of price change and trading volume. For example, some lists highlight the percentage change in price, while others may emphasize the absolute price change. Trading volume is also a common column displayed alongside the price data. These core metrics provide a fundamental view of a stock's daily trading activity. The presentation may vary, but the essential data points remain consistent across platforms.
Understanding the Data and Metrics
When reviewing a top gainers list, several data points are presented for each company. The symbol or ticker, such as RY for Royal Bank of Canada or RGEN for Regenera Insights, is the unique identifier for the stock. The last traded price is shown, for example, $277.51 for Royal Bank. The change column shows the absolute price increase, like +$0.91, while the percentage change column, such as +7.89%, is the key sorting metric. Trading volume, indicated as 4,293K, shows how many shares have changed hands, offering context on the strength of the move. Lists may also include weighted alpha, a measure of a stock's change over a one-year period, to identify consistent performers. Interpreting these figures together gives a clearer picture of whether a gain is driven by high conviction or low liquidity.
Every entry on a top gainers list contains specific, standardized information. Key data points displayed for each stock typically include the company name, its stock symbol, and the last traded price. The lists also show the change in price in both absolute and percentage terms. Furthermore, the trading volume for the session is a standard column. This set of information forms the basic template for most gainers lists.
- The company symbol (e.g., BB for BlackBerry Limited).
- The company name.
- The absolute price change (e.g., +$0.91).
- The percentage price change (e.g., +7.89%).
- The trading volume (e.g., 4,293K shares).
This consistent format allows for quick comparison and analysis across dozens of different securities on a single screen. Investors can easily scan for the largest percentage gainers or the stocks with the highest volume. The standardized layout means the data for a large bank like Royal Bank of Canada is presented the same way as for a smaller venture company. This efficiency is crucial for making rapid assessments during the trading day. It enables a side-by-side evaluation of performance metrics.
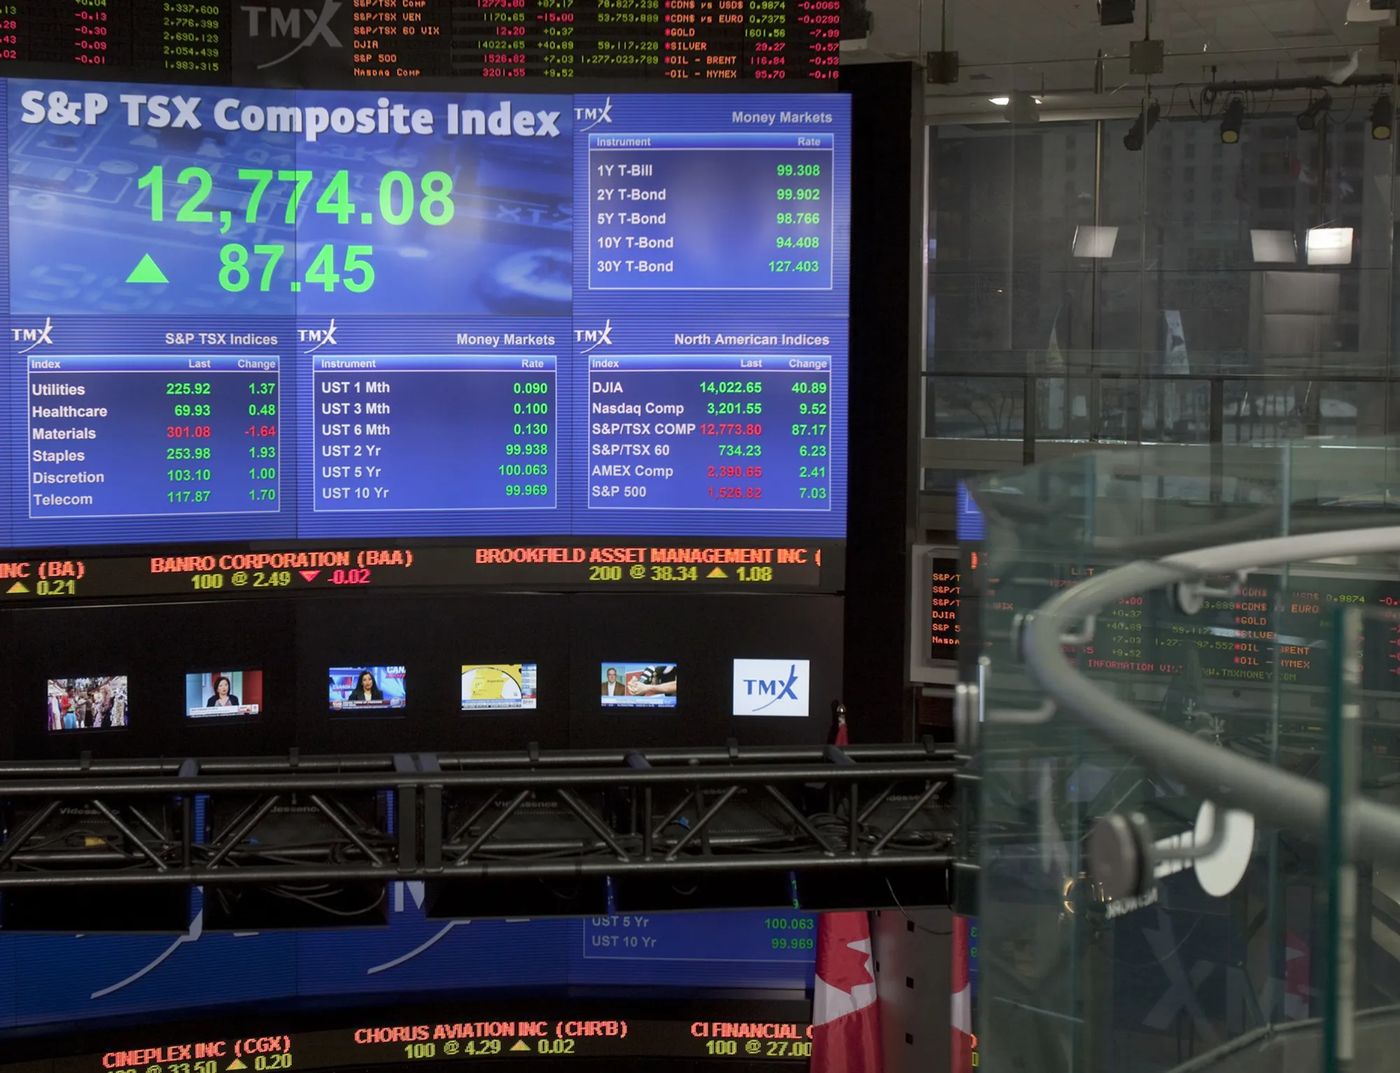
Examples of Recent Top Gaining Stocks
Top gainers can come from any sector and vary significantly in company size and share price. The TSX Venture Exchange, which lists smaller, emerging companies, often features stocks with larger percentage moves, such as Regenera Insights Inc. and Candelaria Mining Corp. Other significant movers on a given day have included Ensign Energy Services Inc., up 6.57%, and Allied Properties Real Estate Investment Trust, up 3.31%. Even large-cap stalwarts like Brookfield Corporation and Power Corporation of Canada regularly appear on gainers lists with more modest percentage increases, reflecting broad market trends.
Recent trading sessions have highlighted a diverse range of companies as top performers. Examples of stocks that have appeared on these lists include Greenhawk Resources Inc. and Oceanic Wind Energy Inc. from the TSX Venture exchange. Other notable gainers have included Regenera Insights Inc. and Fintech Select Ltd. Larger TSX-listed companies like BlackBerry Limited and Shopify Inc. have also appeared on gainers lists. This demonstrates that momentum can occur across the market spectrum.
- BlackBerry Limited (TSX:BB) with a gain of +7.89%.
- Regenera Insights Inc. (RGEN.CN) on the Canadian Securities Exchange.
- Lithium Africa Corp. (LAF) with a gain of +37.93%.
- K2 Gold Corporation (KTO) with a gain of +24.64%.
- Oceanic Wind Energy Inc. (NKW-H.V) on the TSX Venture.
- Fintech Select Ltd. (FTEC.V) on the TSX Venture.
- Volatus Aerospace Inc. (FLT) with a gain of +2.00%.
- Silver Tiger Metals Inc. (SLVR) with a gain of +2.60%.
This variety shows that momentum can be found across technology, mining, energy, and industrial sectors. For instance, technology is represented by companies like BlackBerry Limited and Tevano Systems Holdings. The mining sector includes gainers such as Candelaria Mining Corp. and Silver Tiger Metals Inc. Energy companies like Ensign Energy Services Inc. also feature on these lists. Industrial firms such as Volatus Aerospace Inc. round out the diverse group of top performers.
The Role of Different Canadian Exchanges
Canada's multi-tiered public market structure means top gainers lists are segmented by exchange. The Toronto Stock Exchange is the senior market, home to large, established companies like the major banks and energy firms. The TSX Venture Exchange lists smaller, early-stage companies in sectors like mining and technology, which can be more volatile. The Canadian Securities Exchange also provides lists for its listed companies. Each exchange publishes its own most active, top gainers, and top losers data. Furthermore, data for US markets like the NASDAQ and NYSE is also tracked, providing context for interlisted Canadian companies and broader North American trends. This structure allows investors to focus on the market segment that matches their investment strategy and risk tolerance.
Each exchange provides distinct data feeds that investors monitor for top performers. The specific lists tracked by major exchanges include the TSX Top % Gainers and the TSX Venture Top % Gainers. The NEX Board and the CSE also publish their own lists of most active and top gainers. US exchanges like the NASDAQ and NYSE provide similar data for their listed securities. Investors often consult multiple lists to get a complete market picture.
- TSX: Most Active, Top % Gainers, Top % Losers.
- TSX Venture: Most Active, Top % Gainers, Top % Losers.
- NEX Board: Most Active, Top % Gainers, Top % Losers.
- Canadian Securities Exchange (CSE): Most Active, Top % Gainers, Top % Losers.
- US markets like NASDAQ and NYSE also have their own Most Active and Top % Gainers lists.
Monitoring these separate lists is essential because a top gainer on the volatile TSX Venture exchange represents a very different risk profile than a top gainer on the senior TSX. Stocks on the TSX Venture are often smaller, early-stage companies with higher volatility and lower liquidity. In contrast, top gainers on the TSX frequently include large, established firms like the Royal Bank of Canada or Enbridge Inc. The reasons for a price surge and the potential for sustained growth differ greatly between these exchanges. Therefore, understanding the exchange context is a critical part of the analysis.

How Market Context Influences Gainers
The list of top gainers does not exist in a vacuum. It is influenced by the overall market environment. Major Canadian and US indices like the TSX, S&P 500, and DOW provide the backdrop. For example, on a day when the TSX is up 0.5% to 36,107.96 and the DOW is up 1.02%, a positive market sentiment often lifts many stocks. Sector rotations, where money flows from one industry to another, can cause entire groups of stocks to appear on the gainers list. Commodity price movements, such as a 1.06% rise in oil to $98.86, directly impact gainers in the energy sector. Company-specific news like earnings reports or regulatory approvals is another primary driver of significant single-day price appreciation for individual stocks.
The performance of major market indices provides crucial context for interpreting daily gainers. Key benchmarks that set the tone include the TSX Composite Index for the Canadian market. For US markets, investors watch the S&P 500, the Dow Jones Industrial Average, and the NASDAQ Composite. The movement of commodities like oil, which is itself a key benchmark, can also influence sector performance. A strong day for these broad indices often creates a positive environment for many individual stocks to rise.
- The TSX Composite Index, which closed at 36,107.96, up 179.33 points or 0.5%.
- The S&P 500 Index, which closed at 7,712.57, up 21.84 points or 0.28%.
- The Dow Jones Industrial Average, which closed at 52,495.88, up 529.85 points or 1.02%.
- The NASDAQ Composite Index, which closed at 26,424.82, down 6.07 points or 0.02%.
- Commodity prices like oil, which traded at $98.86, up 1.04 or 1.06%.
A strong day for the broader indices often correlates with a larger number of stocks posting gains, while a weak market can make significant individual gains more notable. For example, if the TSX is up significantly, many constituent stocks may experience positive price movement. Conversely, on a day when major indices are down, a stock posting a large gain stands out against the negative trend. This context helps investors distinguish between broad market momentum and company-specific news. It is important to consider whether a stock's gain is part of a wider rally or an isolated event.
Key Considerations for Investors
Reviewing top gainers lists is a useful activity, but it requires careful interpretation. A high percentage gain on very low trading volume may not indicate sustainable momentum and could be prone to sharp reversals. The price of a stock is just one metric. Understanding the company's fundamentals and the reason for the price move is crucial. Many top gainers are highly speculative, especially on the venture exchange, and carry substantial risk. These lists show what has already happened and are not predictive of future performance. Investors should use them as a starting point for research rather than as a direct guide for investment decisions. Integrating this data with other analysis forms a more complete view of market opportunities.
When analyzing top gainers, investors should be aware of several important limitations and risks associated with these lists. Critical factors to consider include the fact that these lists show only short-term price performance. They do not provide information on the company's financial health or the reason for the price move. The data is often delayed by at least 15 minutes for public viewers, so it is not real-time. Furthermore, low-priced stocks can show extremely high percentage gains from very small absolute price changes, which can be misleading.
- Price data is typically delayed by at least 15 minutes for public viewers.
- A stock's appearance on the list reflects past price action, not future performance.
- High percentage gains are often associated with low-priced, speculative stocks.
- Low trading volume can exaggerate price moves and increase volatility.
- The lists do not provide information on company fundamentals or news catalysts.
- They should be one tool among many in an investor's research process.
Relying solely on top gainers lists for investment decisions can lead to poor outcomes due to the lack of context and the inherent focus on short-term price movements. A stock's appearance on the list does not indicate its future direction or intrinsic value. The price increase may be driven by speculation or news that is already reflected in the price. Without understanding the underlying fundamentals, an investor may be buying at a peak. Therefore, these lists are best used as a starting point for further research rather than as a direct buy signal.
Frequently asked questions
Where can I find a list of top gainers on the TSX?
The primary official source for Toronto Stock Exchange data is the TMX Money website, which features a TSX Today section with Top Market Movers and Top % Gainers lists. These lists include companies like Royal Bank of Canada and TC Energy Corporation. The data is updated in real time but is delayed by at least 15 minutes for public viewers. Other financial platforms also provide these lists, often categorising gainers by exchange, including TSX Venture and Canadian Securities Exchange. The TSX itself publishes top percentage gainers and losers on its official market data pages.
Why do some stocks have huge percentage gains?
Large percentage gains frequently occur with lower priced stocks, where a small absolute price increase results in a significant percentage move. For instance, stocks like Tevano Systems Holdings have shown daily gains of 33.33 percent. These stocks are often listed on the TSX Venture Exchange or the Canadian Securities Exchange and can be influenced by speculative trading, corporate news announcements, or low liquidity. Examples from the data include Regenera Insights Inc and Candelaria Mining Corp, which are typical of such high volatility securities. This phenomenon is less common with large, established companies on the main TSX board.
Do top gainers lists include US stocks?
Yes, many Canadian financial data services track and display top gainers for major US markets alongside Canadian exchanges. Real time stock gainers and losers lists for Canada and US markets typically include indices like the S&P 500, DOW, and NASDAQ. These services provide performance data for US markets, which is relevant for Canadian investors interested in US equities. The lists are often presented separately by exchange, such as NASDAQ or NYSE, but are available within the same financial platforms that report on Canadian stocks like those on the TSX.
What is the difference between 'top gainers' and 'most active'?
Top gainers lists are ranked by the largest percentage price increase during a trading session, highlighting stocks like BlackBerry Limited which gained 7.89 percent. Most active lists are ranked by the highest trading volume, measured in the number of shares traded, featuring companies like Enbridge Inc with high volume. A stock can appear on both lists if it experiences substantial price appreciation alongside high investor interest, as seen with TC Energy Corporation. However, they measure fundamentally different aspects of market activity: one measures price momentum, while the other measures trading liquidity and investor attention.
Should I buy a stock just because it is a top gainer?
A stock appearing on a top gainers list only indicates past price performance and does not guarantee future gains. The price increase may be driven by speculative trading, low liquidity, or news that is already reflected in the price, as often seen with small cap stocks on the TSX Venture. Investors should conduct thorough research on the company's fundamentals, financial health, and the specific reasons behind the price move before investing. Relying solely on a top gainers list for investment decisions is considered high risk, as these stocks can be highly volatile and may not sustain their gains.
Sources and further reading
- TSX, Toronto Stock Exchange investcom.com
This article explains how things work and is not financial, tax or legal advice. Rules, limits and rates change, so check the current figures with the Canada Revenue Agency, your province or your financial institution before you act.