Gold technical analysis is the study of historical price and volume data to identify patterns that may suggest future price direction for the yellow metal. For Canadian traders and investors, this approach is particularly relevant because gold, as a non-cash-generating asset, lacks a traditional intrinsic value and is primarily driven by market sentiment. Technical analysis provides tools to interpret these sentiment-driven price movements, complementing fundamental analysis of factors like currency strength and geopolitical events. Understanding these techniques can help market participants make more informed decisions when trading gold contracts or related financial instruments.
The Foundations of Technical Analysis for Gold
Technical analysis for gold operates on the core principle that financial markets move in patterns that tend to repeat themselves over time. This methodology involves examining past price data and trading volume to forecast potential future price movements. The foundational assumption is that all currently known information that could affect an asset's price is already reflected in its market price and trading activity. For gold, this becomes a critical framework because the metal does not generate cash flows like a company or have straightforward supply-demand fundamentals like industrial commodities. Instead, its value is relative and heavily influenced by investor perception, making the identification of recurring sentiment patterns through price charts a valuable exercise. Analysts look for specific configurations in how gold has traded to gauge whether the price is more likely to move higher or lower based on historical precedent.
A straightforward example of this approach would involve identifying a current market condition, such as gold appreciating for seven consecutive trading days. An analyst would then search historical data for all previous instances where gold showed a similar seven-day rally. By examining what happened on the eighth day in those past cases, the analyst might find a statistical tendency, such as a strong appreciation occurring 90 percent of the time. Under the assumption that patterns repeat, this historical tendency would then inform a view on the likely direction for the current eighth day. In practice, the patterns are rarely this simple and analysts incorporate volume data and more complex chart formations. The goal is to systematically remove emotion from trading decisions by relying on observable, quantifiable price action and historical tendencies within the gold market.
Why Technical Analysis Applies to Gold Markets
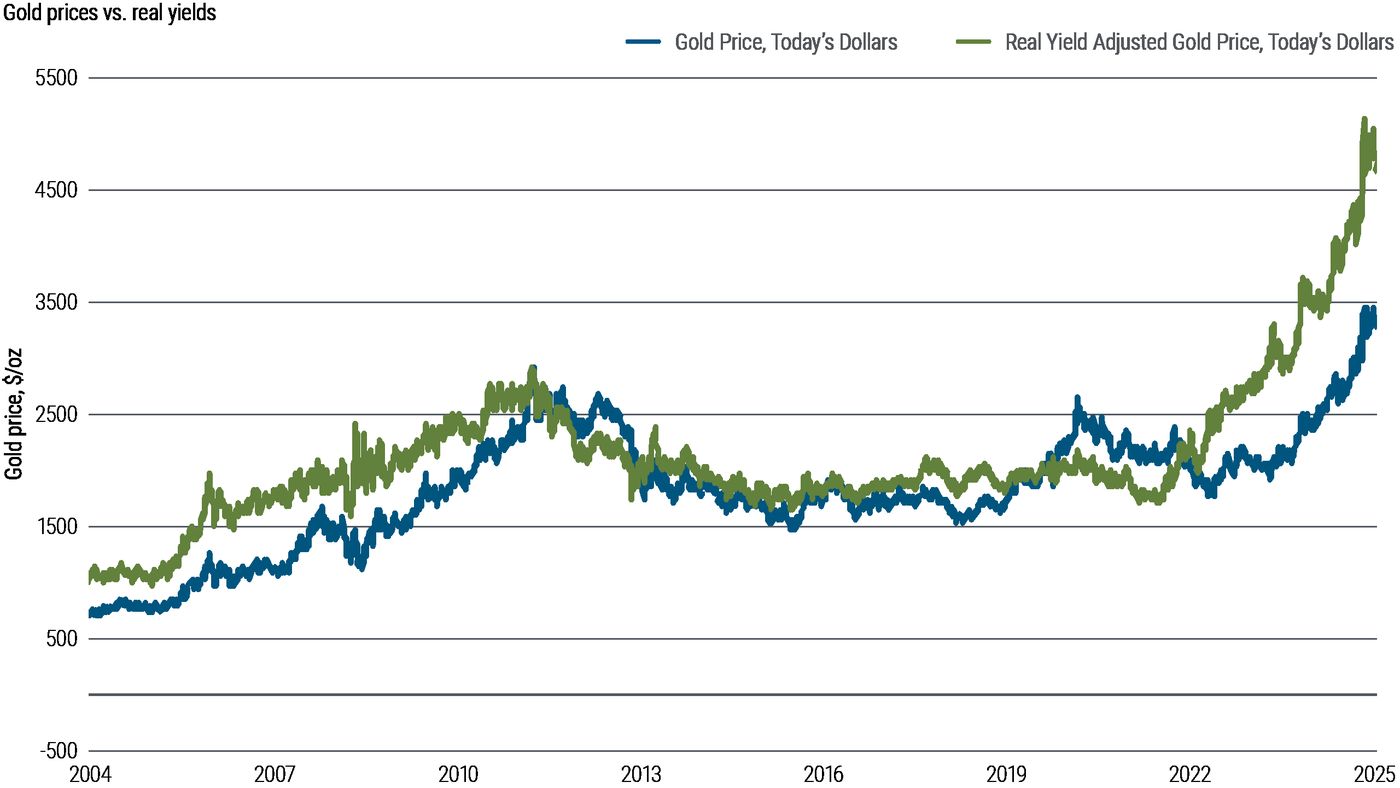
Gold presents a unique case for market analysis because it cannot be valued using traditional methods applied to stocks or most commodities. As an asset that does not produce cash flows and has minimal industrial consumption relative to its investment stock, gold lacks a calculable intrinsic value. Its price is essentially a reflection of collective market sentiment, acting more as a currency or an anti-fiat currency than a typical commodity. This characteristic makes technical analysis a particularly relevant tool, as it focuses on interpreting the mood of the market as manifested through price charts. While fundamental factors like central bank policy, inflation expectations, and geopolitical instability are important, their impact on gold occurs through shifts in investor psychology, which can form identifiable patterns on a chart.
Fundamental drivers do not operate in a vacuum, and shifts in market sentiment are based on observations of changes in the objective economic and political landscape. However, the link between a specific news event and the subsequent gold price movement is not always direct or predictable. Technical analysis helps bridge this gap by identifying how the market has historically reacted under similar chart-based conditions, regardless of the specific headline at the time. It provides a framework for understanding whether current price action suggests a continuation of a trend or a potential reversal. For traders, this means technical analysis serves as one of several tools to assess the gold market, offering insights derived purely from the market's own behaviour and the recurring patterns of buyer and seller interaction over time.
Core Tools and Indicators for Gold Analysis
Technical analysts use a wide array of tools to study the gold market, with common indicators including moving averages, the Relative Strength Index (RSI), and the Moving Average Convergence Divergence (MACD). The RSI is a momentum oscillator that measures the speed and change of price movements, typically on a scale from zero to one hundred. For instance, a weekly RSI for gold above 75 has been noted as a level that can make bulls uncomfortable following a significant rally. The MACD is another momentum indicator that shows the relationship between two moving averages of an asset's price, helping to identify potential buy and sell signals. Beyond these oscillators, foundational charting concepts are universally applied. Support and resistance levels are key horizontal or diagonal lines on a chart that indicate where the price has historically had difficulty falling below or rising above, respectively. The analysis of volume confirms the strength of a price move, with high volume during a breakout adding credibility to the new trend. Trendlines are drawn to connect successive highs or lows, defining the prevailing market direction. These tools are not used in isolation but are combined to build a more complete picture of market structure and potential turning points for gold prices.
Practical Application: Identifying Trends and Reversals
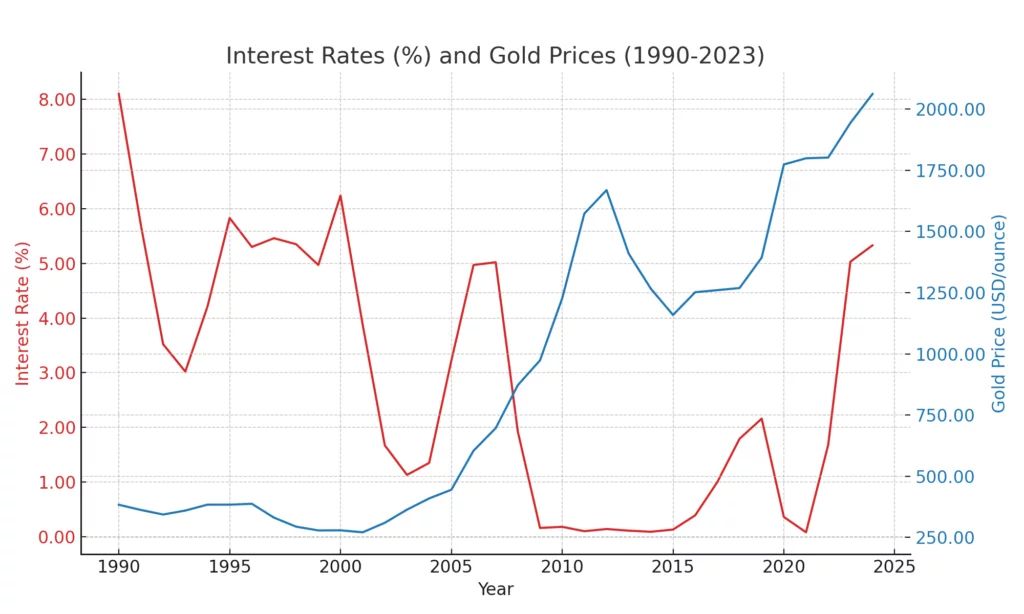
A primary objective of gold technical analysis is to identify the prevailing market trend and spot potential points where that trend may reverse. The first step for many analysts is to determine the long-term trend by examining higher time frame charts, such as weekly or monthly views. Once the major trend is established, the next step involves identifying if and when the price is making corrective moves in the opposite direction, which are often opportunities within the broader trend. For example, in an established long-term uptrend, a pullback to a key support level might be analysed as a potential buying opportunity rather than a trend change. This process requires interpreting price action in the context of support and resistance levels and momentum indicators.
One specific technique for spotting reversals involves the concept of a triangle apex. This method involves drawing converging trendlines for support and resistance, creating a triangle pattern on the chart. The point where these two lines converge, known as the apex, can sometimes indicate a potential time and price zone for a trend reversal. An analysis from April 2018 applied this technique to gold, marking multiple potential reversal points with vertical dashed lines where various support and resistance lines crossed. The observation was that gold reversed its price direction very close to these triangle-apex-based reversal points, with the delay being almost imperceptible. This example illustrates how pattern recognition beyond basic indicators can be applied to forecast changes in gold's price direction, providing traders with specific levels and times to watch for a shift in market momentum.
- Identify the long-term trend on higher time frame charts.
- Identify if the trend is making corrections in the other direction.
- Draw support and resistance lines to form chart patterns like triangles.
- Watch for the triangle apex, where converging lines may signal a reversal.
- Mark potential reversal points where multiple support and resistance lines cross.
- Analyse price action at these key levels for confirmation of a trend change.
The Structure and Dynamics of the Gold Market
The international gold market is a highly liquid arena where the metal is traded in troy ounces and primarily quoted against the United States dollar. This structure is similar to forex currency pairs, granting traders the flexibility to take positions based on their expectation of the dollar price of gold rising or falling. Many participants trade gold without physically owning it through instruments like Contracts for Difference (CFDs), which allow for speculation on price movements. In a CFD trade, profits or losses are realized based on the change in the gold price while the contract is open, providing exposure to the market without the logistical concerns of physical delivery. The market's liquidity ensures constant price discovery and the potential for significant returns due to daily price movements.
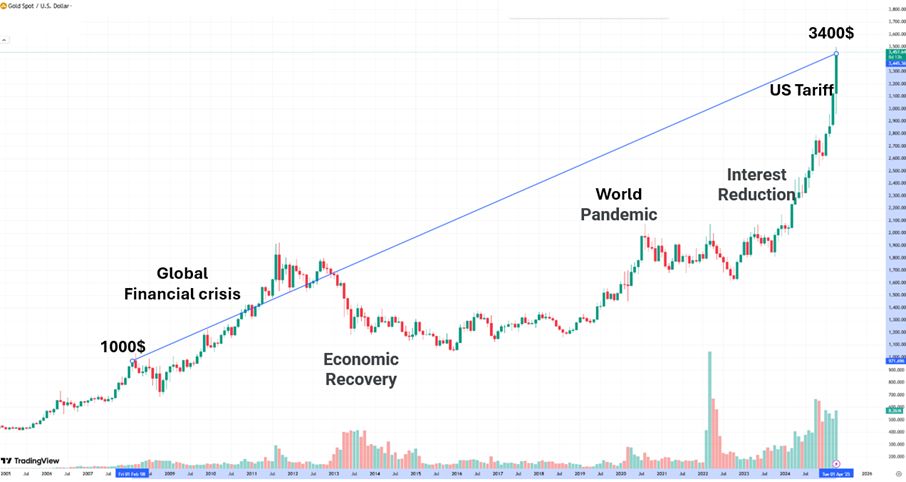
Several fundamental factors drive volatility and trends in the gold market, which technical analysis aims to interpret after the fact. Supply and demand dynamics play a role, where high investment demand coupled with constrained supply can drive prices upward. The performance of the US dollar is inversely correlated with gold much of the time, as a weaker dollar often increases demand for gold as an alternative store of value. Periods of stock market uncertainty or sharp declines frequently see investors turning to gold as a safe-haven asset, which increases buying pressure. Furthermore, geopolitical instability or conflict tends to push gold trading prices higher as capital seeks security. While these are fundamental catalysts, their ultimate effect on price is filtered through market sentiment and manifests in the price charts that technical analysts study.
- Supply and demand issues: high demand and low supply drive up trading prices.
- USD currency performance: an under-performing dollar often causes demand to rise.
- Stock market uncertainty: investors turning to gold as a safe haven affects the price.
- Political instability or conflict: gold trading prices go up as investors look to safe havens.
Essential Considerations for Canadian Traders
Canadian traders engaging in gold technical analysis must account for the fact that the primary global market quotes gold in US dollars. This means that for a Canadian investor, the final return in Canadian dollar terms will also be affected by fluctuations in the USD/CAD exchange rate. A rising gold price in US dollars could be partially offset or amplified by a moving currency cross, adding an additional layer of analysis. Furthermore, access to real-time and historical charting data is crucial for effective technical analysis. Many trading platforms provide dynamic charts with live data feeds, delayed quotes, and a suite of technical indicators like moving averages and RSI, which are essential tools for the analyst. These platforms often allow for backtesting strategies against historical data to see how certain technical setups would have performed in past market conditions.
It is vital to remember that technical analysis deals in probabilities, not certainties, and no single tool or pattern guarantees a future price movement. Market conditions can change rapidly, making it crucial to consider multiple factors and time frames. A disciplined approach involves using technical analysis to define clear risk parameters, such as placing stop-loss orders below identified support levels in a long trade. Many brokers offer demo accounts where traders can practice gold technical analysis and test strategies without financial exposure, which is a recommended step for beginners. The key is to develop a consistent methodology that combines several technical tools to confirm signals, rather than relying on a single indicator, and to always ensure sufficient capital is available to cover potential losses from leveraged positions.
- Account for USD/CAD exchange rate fluctuations when calculating final returns.
- Use platforms providing real-time data, delayed quotes, and technical indicators.
- Practice analysis and test strategies using a broker's demo account first.
- Define risk parameters like stop-loss orders based on technical levels.
- Combine multiple technical tools to confirm trading signals.
- Ensure sufficient capital to cover potential losses from leveraged positions.
Common Analytical Frameworks and Chart Patterns
Beyond individual indicators, technical analysts for gold employ broader frameworks and recognize common chart patterns. Trend analysis is a fundamental component, classifying market movements as uptrends, downtrends, or sideways consolidations. Within these trends, specific patterns are watched for. For instance, a breakout above a key resistance level on high volume is seen as a bullish signal suggesting further gains, while a breakdown below support indicates bearish momentum. Chart patterns like head and shoulders, double tops or bottoms, and triangles (ascending, descending, and symmetrical) are studied for their predictive qualities regarding trend continuation or reversal. These patterns are formed by the price action itself and are thought to represent the ongoing psychological battle between buyers and sellers.
Analysts also apply the two core tenets of technical analysis to gold: that price action discounts all known information and that prices move in trends. The first tenet implies that anything from interest rate decisions to geopolitical news is already factored into the current gold price by the collective actions of market participants. The second tenet suggests that once a trend in gold is established, it is more likely to continue than to reverse, until clear technical evidence of a breakdown appears. This is why identifying the trend is often the first step in a technical analysis. These frameworks guide the interpretation of the more granular signals from indicators, providing context. For example, a buy signal from a moving average crossover is given more weight if it occurs during an established uptrend and at a historically strong support level, creating a confluence of evidence for a potential trade setup.
Frequently asked questions
What is gold technical analysis?
Gold technical analysis is the study of the gold market's historical price and volume data to identify recurring patterns and trends. It operates on the assumption that market behaviour tends to repeat and that all available information is reflected in the current price. The goal is to use these patterns to form probabilistic views on the future direction of gold prices. This approach is particularly applied to gold because it is a sentiment-driven asset without traditional cash-flow-based valuation.
Why use technical analysis for gold instead of just fundamental analysis?
Technical analysis is used for gold because the metal lacks an intrinsic value derived from cash flows or predominant industrial use, making traditional fundamental valuation difficult. Gold's price is largely a function of market sentiment and relative value against currencies. While fundamentals like dollar strength or geopolitical events are important, their impact is filtered through investor psychology, which can create identifiable patterns on price charts. Technical analysis provides tools to interpret these sentiment-driven patterns directly.
What are the most common technical indicators used for gold?
Common technical indicators for gold include moving averages to identify trends and the Relative Strength Index or RSI to gauge overbought or oversold conditions. The Moving Average Convergence Divergence or MACD is used for momentum and potential buy or sell signals. Analysts also heavily rely on identifying key support and resistance levels. These tools are often used in combination to build a robust view of market conditions.
How is the gold market structured for trading?
The international gold market is highly liquid, with gold priced in US dollars per troy ounce. Traders can speculate on price movements without physical ownership through instruments like Contracts for Difference (CFDs). Profits or losses are based on the change in the gold price while the contract is active. The market is influenced by factors including supply and demand, US dollar performance, stock market uncertainty, and geopolitical instability, all of which affect investor sentiment towards this safe-haven asset.
What does an overbought RSI mean for gold?
An overbought Relative Strength Index or RSI suggests gold may have risen too far and could be due for a price correction. For example, a weekly RSI above 75 is considered too high for bulls to be comfortable following a big rally. It is a momentum indicator that signals potential exhaustion in buying pressure. However, it should not be used alone as market conditions change all the time.
Can technical analysis predict gold prices with certainty?
No, technical analysis cannot predict gold prices with certainty. It deals in probabilities based on historical pattern recognition. The core assumption is that patterns tend to repeat, but this is not a guarantee. Market conditions change constantly, and technical signals can fail. Therefore, it is crucial to use technical analysis as one tool among others, to manage risk diligently with stop-loss orders, and to never rely on a single indicator for trading decisions.
Sources and further reading
- Gold & Silver Technical Analysis, Do it Right goldpriceforecast.com
- Trade Gold | OANDA | Canada oanda.com
This article explains how things work and is not financial, tax or legal advice. Rules, limits and rates change, so check the current figures with the Canada Revenue Agency, your province or your financial institution before you act.