Forecasts for the price of gold vary significantly, with some analysts projecting average prices of $6,000 per ounce by late 2026 and others predicting potential declines. For Canadians, the price is directly affected by the USD/CAD exchange rate, meaning a weakening loonie can increase the cost of gold in Canadian dollars even if the global spot price is stable. Understanding the key economic drivers and analyst projections can help investors contextualize gold's role in a diversified portfolio. This guide examines current forecasts, historical price action, and the specific factors that influence gold's value for Canadian holders.
Current Gold Market Dynamics and Price Action
The gold market in 2026 has been characterized by significant volatility and a predominantly sideways trading pattern after an explosive start to the year. Gold prices posted continuous gains to begin 2026, reaching a peak in late January which marked an all-time high. This rally was followed by a cooling period in late March, with the spot price recently finding an intra-year floor around $4,170 per ounce. As of October 21, 2026, the spot price of gold in Canadian dollars is C$5,791.83 per troy ounce, with the price per gram at C$186.21. The market has been influenced by a complex mix of trade concerns, geopolitical crises, and shifting patterns in central bank activity. Greg Shearer, head of Base & Precious Metals at J.P. Morgan, described gold as being in a technical no-man's land, trading above the 200-day moving average near $4,340 but capped below the 50-day average at $4,730. This sideways movement has coincided with growing investor concerns that the Federal Reserve might respond to energy-driven inflation with interest rate hikes, which has temporarily dampened speculative interest in the metal.
Analyst Forecasts and Price Predictions
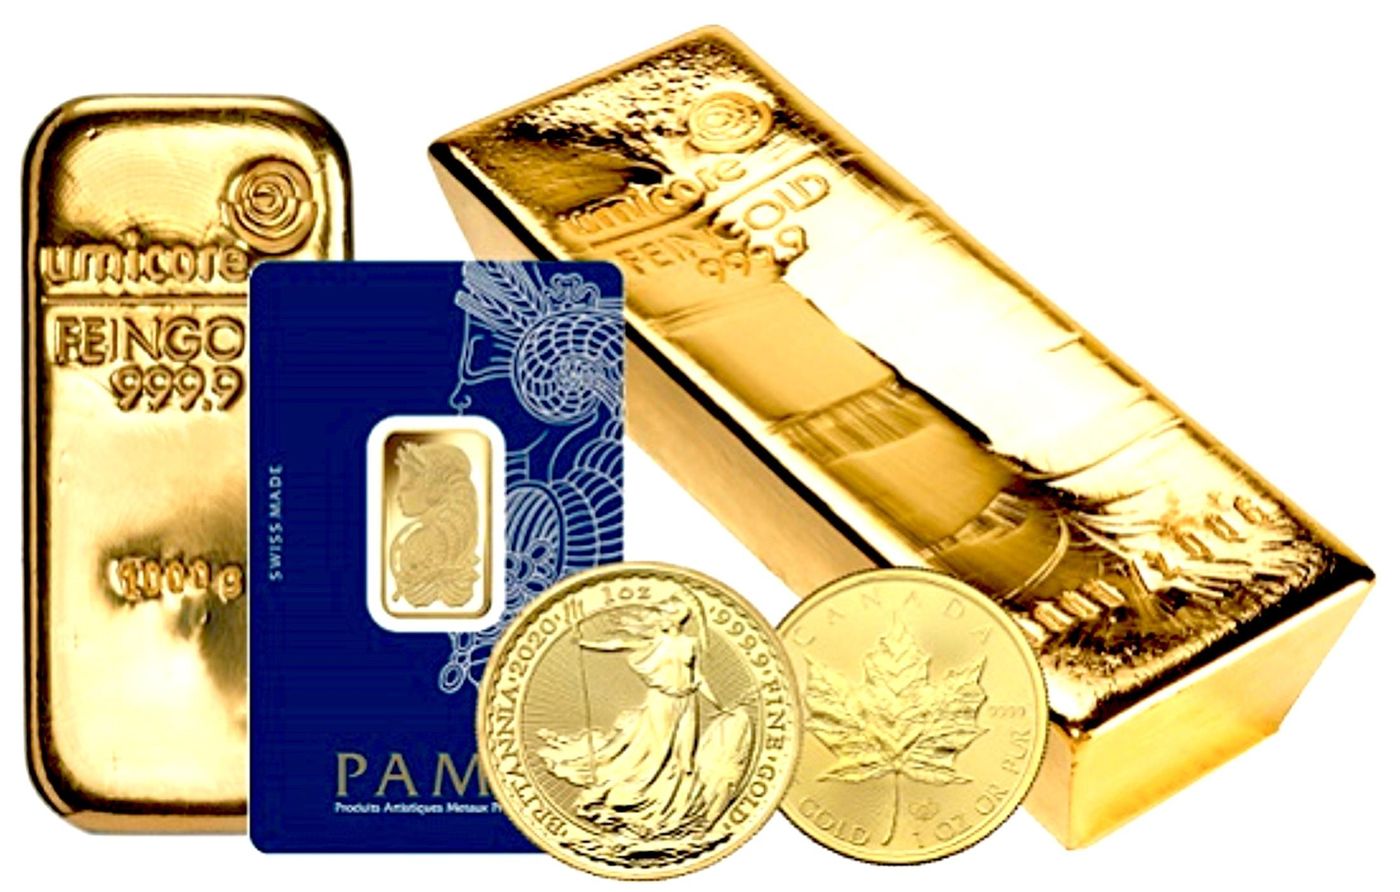
Financial institutions provide a wide range of forecasts for gold, reflecting the uncertainty inherent in predicting commodity prices. J.P. Morgan Global Research offers one of the more bullish near-term outlooks, forecasting that the price per ounce will average $6,000 by the final quarter of 2026. Their projection extends further, with prices expected to rise toward $6,300 per ounce by the end of 2027. Other sources present contrasting views, including a forecast for the gold to Canadian dollar exchange rate (XAU/CAD) to be $4,357.16 in 2027, which would represent a drop of 24.82 percent from the rate current at the time of the forecast. Longer-term projections looking toward 2030 suggest gold could reach levels between $6,200 and over $10,000 per ounce, though these estimates involve greater speculation. It is crucial to understand that these are forecasts based on current data and assumptions, and actual market performance may differ significantly. The disparity in predictions underscores the importance of considering multiple viewpoints and the underlying economic drivers rather than relying on a single projection.
Key Factors Influencing Gold Prices
The price of gold is determined by a confluence of global macroeconomic and geopolitical forces. A primary driver is the movement of real interest rates, as gold, a non-yielding asset, becomes more attractive when real returns on bonds and cash are low or negative. Central bank monetary policy, particularly from the U.S. Federal Reserve and the Bank of Canada, directly impacts these rates. Geopolitical instability and market stress consistently boost safe-haven demand for gold, as seen during periods of tension involving nations like Iran, Israel, and the U.S. Another critical factor is the value of the U.S. dollar, as gold is globally priced in USD. A stronger dollar typically pressures gold prices lower, while a weaker dollar provides support. For Canadian investors, the USD/CAD exchange rate adds a second layer of complexity, as a weakening Canadian dollar can increase the local price of gold even if the U.S. dollar spot price remains flat. Sustained themes driving long-term demand diversification into gold include concerns about higher inflation, U.S. fiscal policy, geopolitical fracturing, and policy unpredictability.
The role of central banks has evolved into a major structural support for the gold market. From 2021 to 2025, central bank gold purchases averaged 225 tons per quarter, roughly double the pace of the 2016 to 2020 period. This trend reflects a strategic shift by nations toward holding assets without counterparty risk. However, reported activity cooled in early 2026, with central banks selling a net 129 tons in the first quarter, led by Türkiye's sale of 60 tons in March. Official reported purchases were only 16 tons for the quarter. A significant amount of central bank activity goes unreported, as there is no mandatory rule to report purchases to the International Monetary Fund. Analysis of alternative data from the London over-the-counter market and Swiss refinery trade flows suggests actual purchases in Q1 2026 were 244 tons, an increase from 208 tons in Q4 2025. A major unreported buyer appears to be China, whose net gold imports surged to 317 tons in Q1 2026, nearly triple the previous quarter, while the People's Bank of China increased its reported purchases from one ton per month to five tons in March and eight tons in April 2026.
Understanding Gold Purity and Pricing in Canada
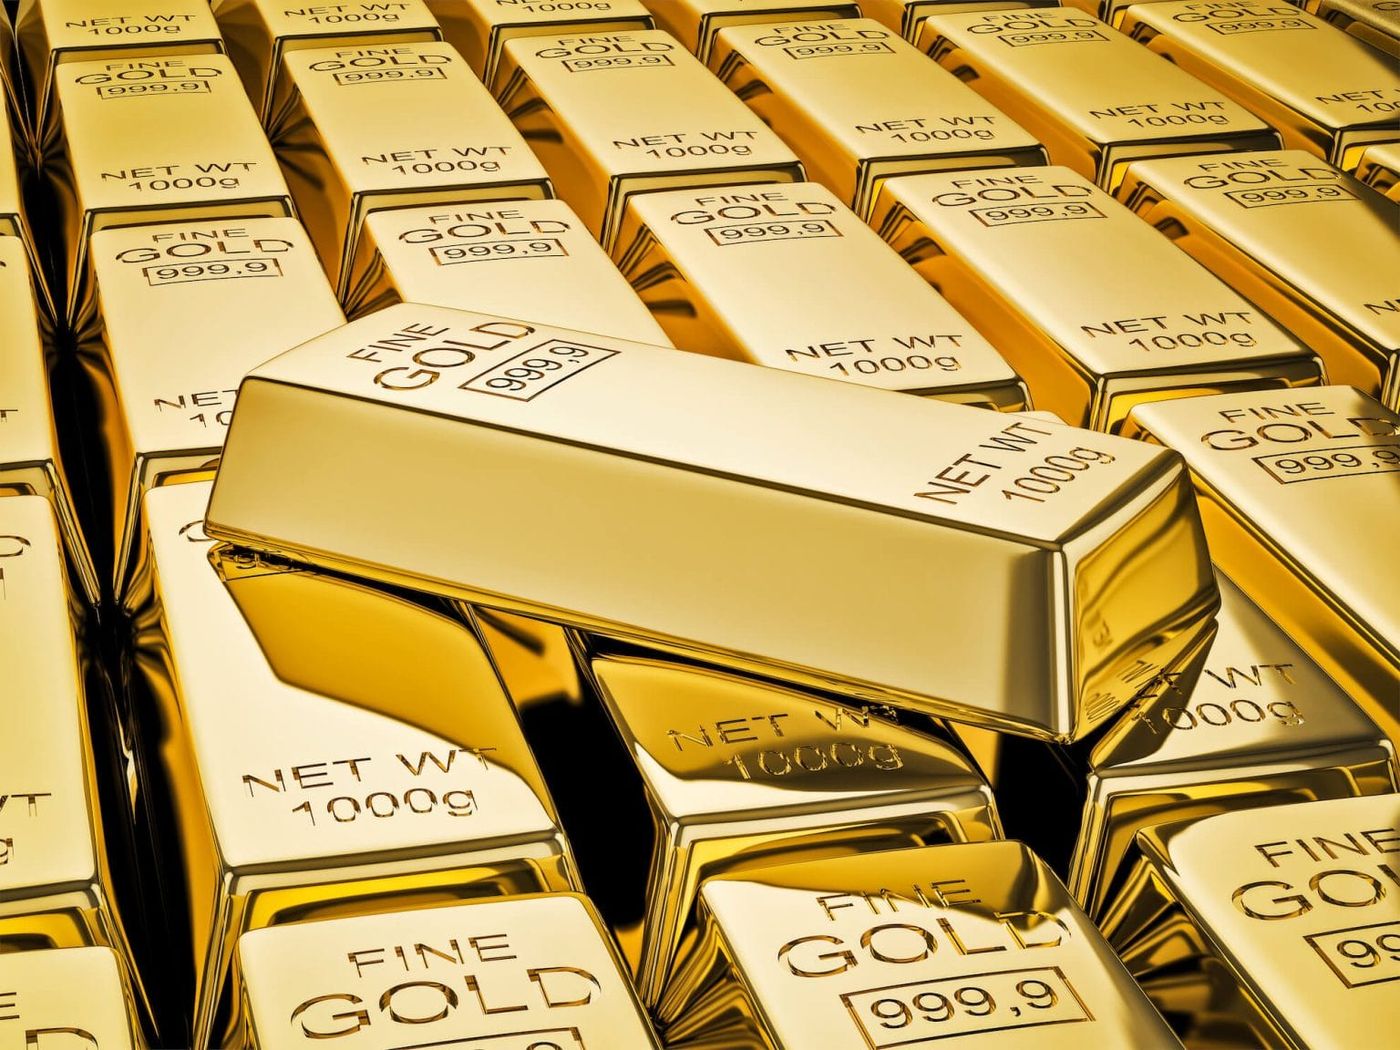
In Canada, the price of physical gold varies significantly based on its purity, which is measured in karats or fineness. The standard trading unit for precious metals worldwide is the troy ounce (31.1034768 grams), and the live price for pure 24-karat gold serves as the benchmark. However, most jewellery and some bullion products are made from lower purities. Under federal precious-metals marking rules, 9-karat gold is the minimum quality permitted for a non-plated gold article carrying a gold quality mark. The live melt value for different purities, as of October 21, 2026, provides a clear illustration of how purity affects value. It is important to note that these melt values are estimates for the raw metal content. Retail premiums for fabricated products like coins or jewellery, or discounts for scrap gold, will apply in actual transactions.
| Karat | Fineness (approx.) | Price per Gram (CAD) |
|---|---|---|
| 22K | 916 | C$170.70 |
| 18K | 750 | C$139.66 |
| 14K | 585 | C$108.62 |
| 10K | 417 | C$77.59 |
Investment-grade bullion, such as the Royal Canadian Mint's Gold Maple Leaf coin, is typically .9999 fine (99.99% pure). The price for such products is based on the live spot price plus a premium that covers minting, distribution, and dealer costs. When calculating the value of a specific gold item, one must use its exact weight and purity to determine its pure gold content before applying the current spot price. The expanded gold calculator available on financial portals can assist with this process, though it provides metal value only and not a guaranteed buy or sell price.
Historical Gold Price Context and Major Milestones
Gold's price history is marked by long cycles driven by monetary policy, inflation, and geopolitical events. Before 1971, gold anchored global monetary systems under various gold standards, with its price officially fixed. The Bretton Woods system, established in 1944, pegged global currencies to the U.S. dollar, which was convertible to gold at $35 per ounce. This system collapsed in 1971 with the Nixon Shock, freeing gold to trade on open markets at $43.15 per ounce. The metal then entered a major bull market, soaring to $850 per ounce in January 1980 amid high inflation and the Iran hostage crisis. Aggressive Federal Reserve rate hikes subsequently triggered a long bear market, pushing gold to a low of $252 per ounce in 1999. The attacks of September 11, 2001, and the subsequent global financial crisis reignited safe-haven demand, driving gold to a then-record high over $1,900 in September 2011. A multi-year correction followed, with prices bottoming near $1,050 in December 2015 during the Fed's tapering of quantitative easing.
After a period of consolidation, a new bull leg began with a breakout above $2,000 in October 2023. This rally culminated in the all-time high reached in late January 2026, representing a gain of approximately 180 percent from the October 2023 level. This peak was followed by a violent 20 percent correction when a hawkish candidate was nominated for Federal Reserve Chair, demonstrating gold's continued sensitivity to interest rate expectations. The price subsequently rebounded from a floor around $4,400 to surpass $5,200 by late February 2026, illustrating the metal's volatility even within a broader uptrend.
How Canadians Can Monitor and Analyze Gold Prices
Canadian investors have several tools and resources to track the price of gold effectively. The most important reference is the live spot price, which is derived from global over-the-counter trading and futures markets. This price is quoted in U.S. dollars per troy ounce and forms the basis for all local pricing. Financial portals like Kitco provide real-time gold price charts in Canadian dollars, converting the global spot price using the current USD/CAD exchange rate. These charts typically offer multiple timeframes for analysis, including intraday, 30-day, 1-year, 5-year, and 10-year views. To understand whether a price move is driven by gold itself or currency fluctuations, investors can consult indices like the Kitco Global Index (KGX), which strips out the influence of the U.S. dollar's value. Monitoring the decisions of the Bank of Canada is also crucial, as shifts in Canadian interest rates affect the loonie's strength and, consequently, the CAD price of gold. Historical price data is readily available and is essential for putting current price levels into the context of long-term trends and past market cycles.
When following analyst forecasts, it is prudent to review predictions from multiple institutions to gauge the range of expert opinion. Investors should pay close attention to the specific assumptions behind each forecast, such as the path of interest rates, inflation, and geopolitical developments. For those interested in physical gold, understanding the difference between the spot price, the melt value for specific purities, and the retail price for coins or bars is necessary. The live prices for different karats, as shown in the purity table, provide a baseline for the metal content value of jewellery or scrap gold. Ultimately, tracking gold prices requires a dual focus on the global macroeconomic drivers that move the metal and the currency dynamics that translate those movements into Canadian dollar terms.
Frequently asked questions
What is the forecast for the price of gold in 2026?
Forecasts for 2026 vary. J.P. Morgan Global Research projects the price per ounce will average $6,000 by the final quarter of the year. Other forecasts suggest potential volatility, with some sources indicating an average price could rise from $4,792 in August to $6,120 by October 2026. The actual price will depend on evolving economic conditions, central bank policies, and geopolitical events.
What is the gold price prediction for 2027?
Predictions for 2027 also show a wide dispersion. J.P. Morgan anticipates prices rising toward $6,300 per ounce by the end of 2027. In contrast, a separate forecast for the gold to Canadian dollar rate (XAU/CAD) projects a price of $4,357.16 for 2027, which would represent a significant decline from levels in late 2026. These differing views highlight the uncertainty in long-term commodity forecasting.
What is the current price of gold in Canada?
As of October 21, 2026, at 3:39 a.m. EDT, the price of gold in Canada is C$5,791.83 per troy ounce. This equates to C$186.21 per gram and C$186,211.68 per kilogram for 24-karat gold. Prices are based on the bid price from the global spot market and are updated continuously throughout the trading day.
Why are central banks important for gold prices?
Central banks are major holders and buyers of gold, and their purchasing activity provides significant structural demand. From 2021 to 2025, they bought an average of 225 tons per quarter. This trend reflects a strategic shift toward diversifying reserves with assets that have no counterparty risk. Even when reported purchases slow, as in early 2026, substantial buying often continues through unreported channels, providing underlying market support.
What was the all-time high for gold?
Gold reached an all time high at the end of January 2026. This peak was fuelled by strong structural demand for safe haven assets and continued central bank accumulation. After this high, the price suffered a violent 20 percent correction when President Trump nominated a hawkish candidate for Fed Chair. Despite this, gold proved resilient and rebounded from a floor of $4,400 to surpass $5,200 by late February 2026, driven by ongoing structural demand, global volatility, and looming tariff concerns.
How does the Canadian dollar affect the gold price I pay?
The gold price in Canada is set by two moving parts: the global spot gold price in U.S. dollars and the USD/CAD exchange rate. A day when gold rises in U.S. terms but the Canadian dollar strengthens can leave the CAD gold price nearly flat. Conversely, a weakening Canadian dollar can lift the CAD price even when the spot gold price goes nowhere. For Canadian investors, commodity driven swings in the loonie often matter as much as the headlines moving gold in international markets.
Sources and further reading
- Live Gold Price in Canada (CAD) kitco.com
- Will gold prices hit all-time highs again in 2026? jpmorgan.com
- Gold price forecasts and predictions for 2026 to 2050 axi.com
This article explains how things work and is not financial, tax or legal advice. Rules, limits and rates change, so check the current figures with the Canada Revenue Agency, your province or your financial institution before you act.