A salary change calculator is a financial tool that helps you compare your net, or take-home, pay under different income scenarios. It calculates the impact of a raise, a new job offer, or a move to a different province by accounting for all mandatory payroll deductions. For Canadians, this is crucial because provincial income tax rates vary dramatically, significantly affecting how much of your salary you actually keep. Using current federal and provincial tax rates, these calculators provide an estimate of your after-tax income to help you make informed financial decisions.
What a Salary Change Calculator Does
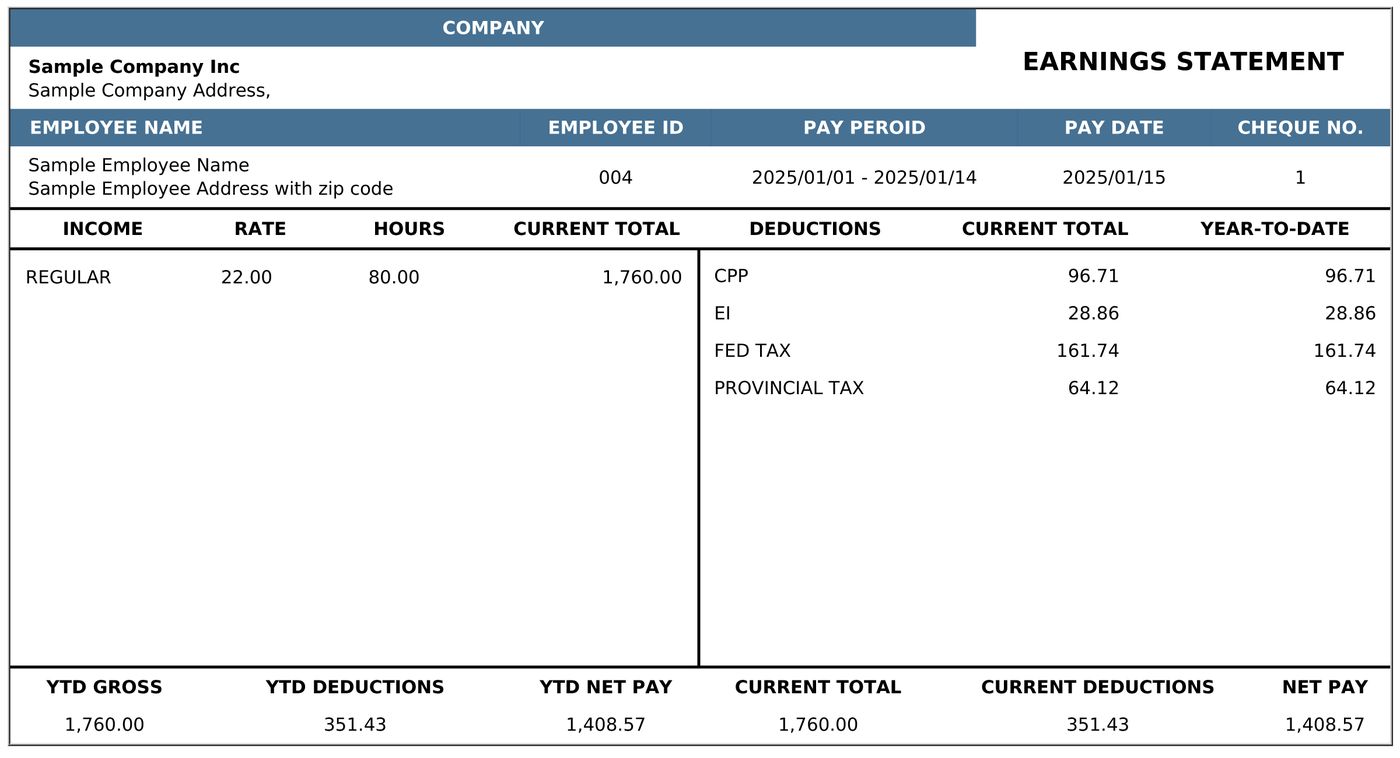
A salary change calculator converts your gross annual income into your net annual income, which is your take-home pay after all deductions. The tool applies the federal and provincial tax rules for a selected tax year, such as 2026, to provide an accurate estimate. It factors in income tax, Canada Pension Plan or Quebec Pension Plan contributions, and Employment Insurance or Quebec Parental Insurance Plan premiums. The calculator can also determine your adjusted hourly wage, which accounts for paid time off like vacation and sick days, showing how much you earn per hour actually worked. This allows for a direct comparison between two salaries or between the same salary in two different Canadian provinces, highlighting the substantial difference provincial taxes can make.
Understanding the Key Inputs and Their Impact
Every input in a salary change calculator directly influences the final net income result. Your gross annual income is the starting point, representing your salary before any deductions. The province you select is perhaps the most critical variable, as each province and territory has its own income tax brackets and rates, which cause large disparities in take-home pay. The tax year determines which set of federal and provincial tax brackets, credits, and contribution limits are applied, as these are updated annually. The amount of paid time off you enter adjusts your effective hourly wage, as you are paid for days you do not work, increasing your earnings per hour worked.
For hourly workers, you would enter your hourly rate and the number of hours you work per week. Full time employees in Canada typically work 35 to 40 hours per week, while part time is generally 30 hours or less. The calculator then multiplies this by the number of working weeks to find your gross annual income. For salaried employees, you enter your fixed annual salary directly. The calculator uses these inputs to first determine total deductions, then subtracts them from gross income to present your net annual income and your effective income tax rate, which is the total tax paid as a percentage of your gross income.
How Provincial Tax Rules Affect Your Pay
Provincial income tax is the single largest factor creating differences in net pay across Canada. Your province of residence on December 31st determines which provincial tax rate applies for your entire tax year. If you move from a high-tax province to a lower-tax province like Alberta before year-end, you will pay the lower province's rates on all your annual income. Alberta consistently has among the lowest provincial income tax, thanks to its structure with an 8% starting rate on the first $60,000 and a 10% rate up to $151,234. On a $100,000 income, you would pay roughly $5,200 in provincial tax in Alberta compared to about $12,200 in Nova Scotia.
Quebec operates its own distinct tax system administered by Revenu Quebec. Residents file separate federal and provincial tax returns. Quebec has higher overall deduction rates when you combine its income tax, the Quebec Pension Plan at a higher rate than the CPP, and QPIP premiums. However, Quebec also funds generous social programs like subsidized daycare and comprehensive parental leave. The three territories Yukon, Northwest Territories, and Nunavut generally have lower provincial tax rates, but this is often offset by a significantly higher cost of living for essentials like housing, food, and travel.
- Alberta: Low provincial tax, no provincial sales tax (PST).
- Quebec: Highest overall payroll deductions, separate tax administration.
- Territories: Lower tax rates but very high cost of living.
- British Columbia: Competitive for high-income earners, no employer health tax for small employers.
Federal Deductions and Tax-Free Allowances
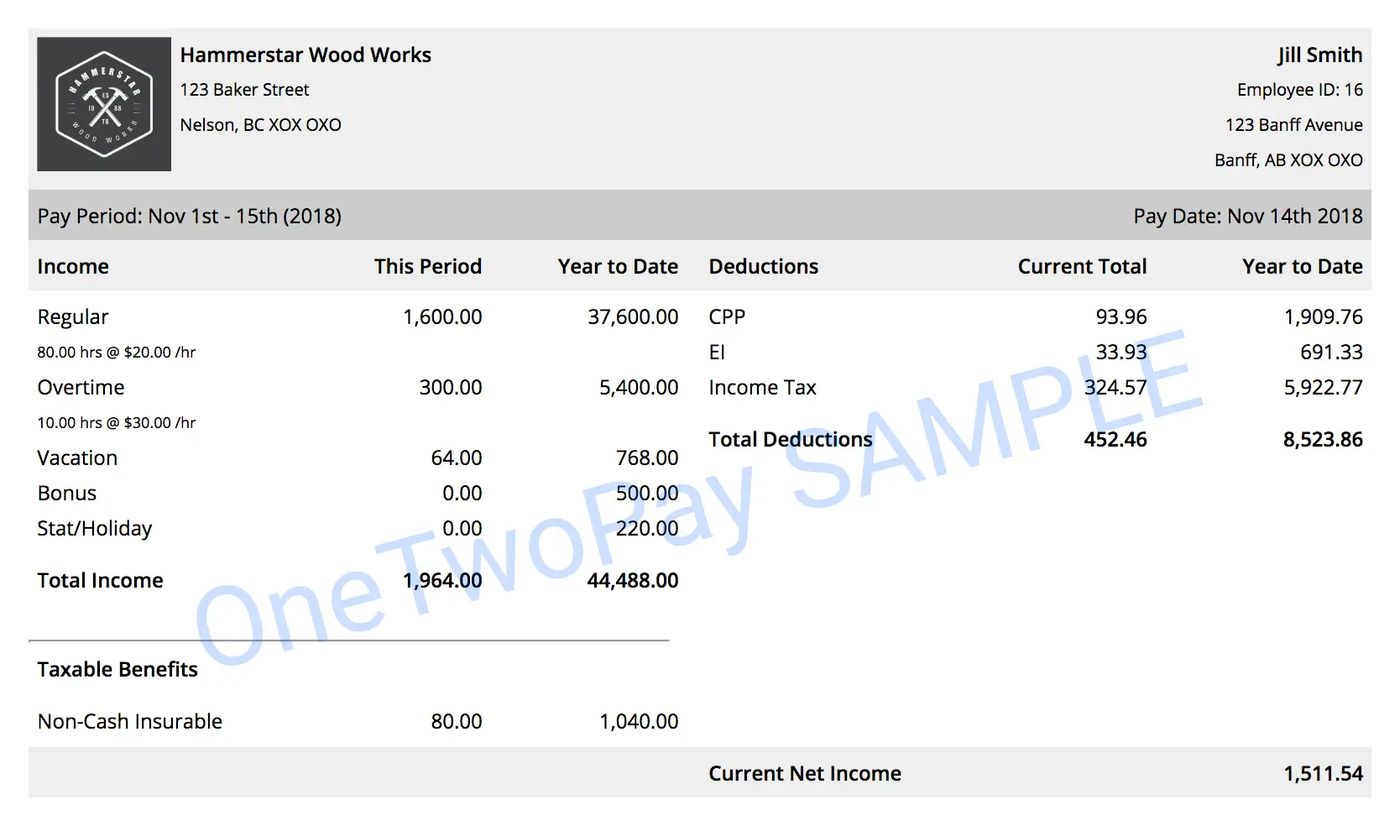
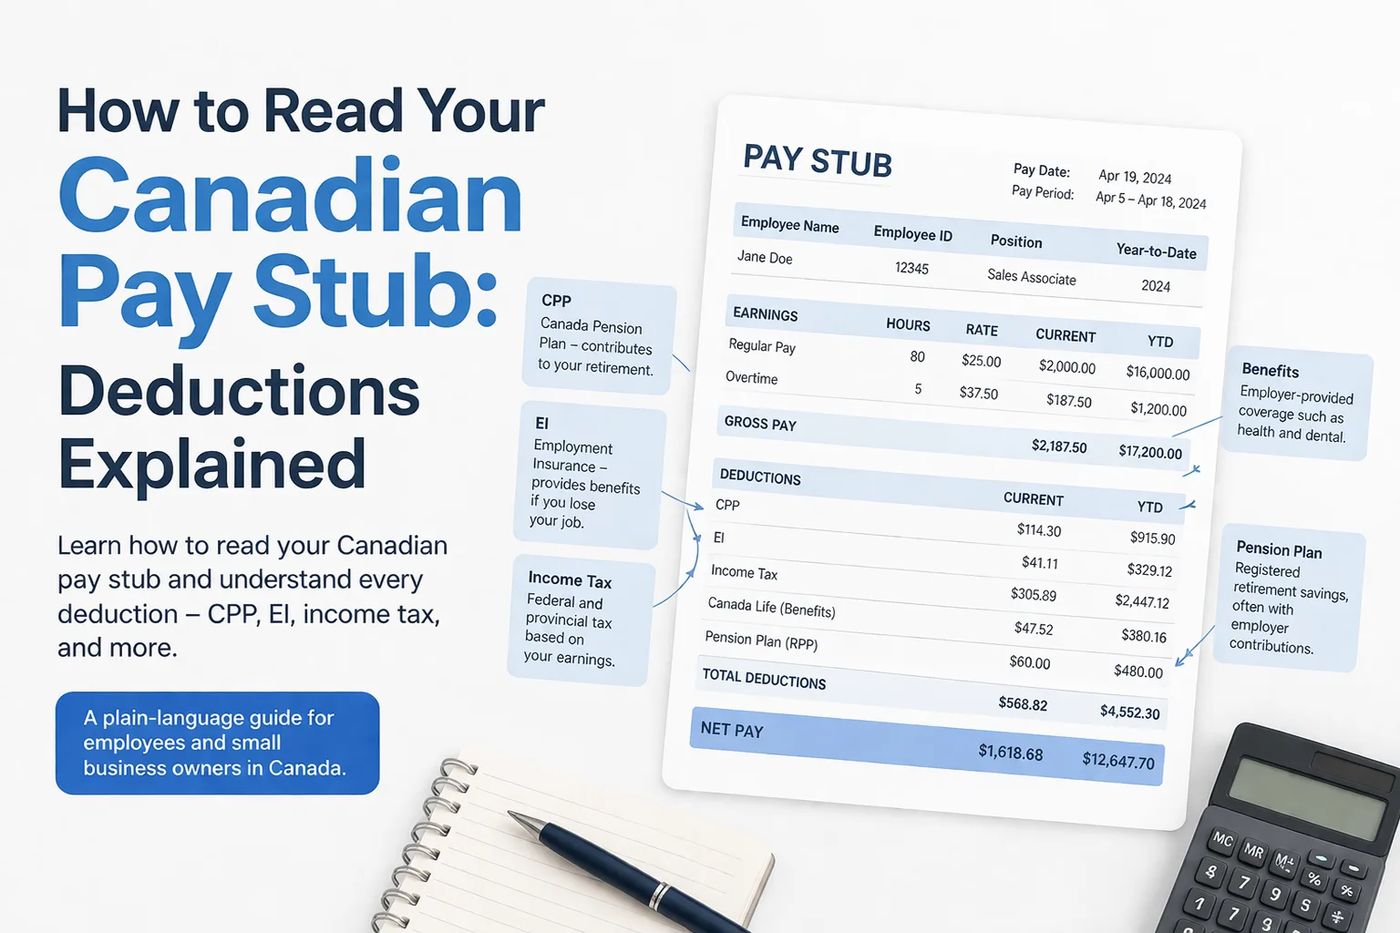
In addition to provincial tax, your pay is subject to mandatory federal deductions. All employed Canadians contribute to the Canada Pension Plan, which provides a retirement pension. You also pay premiums for Employment Insurance, which offers temporary income support. The federal government also collects income tax through a progressive bracket system. A key benefit for all taxpayers is the federal basic personal amount. For the 2025 tax year, this amount is $16,129, meaning the first $16,129 of your income is entirely free from federal income tax. Each province also has its own basic personal amount, providing an additional layer of tax-free income at the provincial level.
Comparing Salaries and Total Compensation
A true salary comparison extends beyond just the gross annual salary figure. You must account for the entire compensation package, which includes the value of employer-provided benefits. These benefits can add thousands of dollars in value to your total compensation and are a critical part of any job offer analysis. A salary with excellent benefits may be financially superior to a higher salary with no benefits at all. When comparing a traditional salaried position to contract work, you must add the value of benefits and job security that are absent for contractors. A common rule is that contractor rates need to be 25% to 40% higher than an equivalent salary to provide the same total financial value.
- Employer pension contributions (typically 3% to 8% of salary).
- Group health and dental insurance (valued at $2,000 to $5,000 per year).
- RRSP matching programs.
- Paid vacation days and professional development budgets.
- Stock options and work-from-home allowances.
Incorporating Cost of Living into Your Decision
A higher net pay in one province does not automatically mean greater disposable income or a better standard of living. The cost of living, particularly housing costs, varies enormously across Canadian cities and can completely offset tax advantages. For example, the average rent in Toronto is about $2,500 per month, while in Winnipeg it is approximately $1,300. A salary that provides a comfortable lifestyle in Winnipeg might leave you struggling in Toronto, even if the Toronto salary is higher on paper. Therefore, you should use the net pay figure from a salary calculator alongside reliable cost-of-living data for housing, food, transportation, and childcare. This combined analysis gives you a realistic picture of your financial position in a new location.
Provincial Tax Rates for Comparison
The table below illustrates how provincial tax policies differ, using general descriptions of their structures. These differences are why the province you select in a calculator has such a powerful effect on your results. Alberta's system is notably flat and low, while Quebec's is complex and high. The territories offer low rates but come with other financial challenges. When you input a salary into a calculator, it applies the exact bracket rates and income thresholds for your selected province and tax year to compute your precise provincial tax liability.
| Province/Territory | Key Tax Characteristic |
|---|---|
| Quebec | Highest combined rates. Separate QPP, QPIP. Administers own tax. |
| Nunavut | Lowest starting rate at 4%, but brackets rise quickly. |
| British Columbia | Competitive for high incomes. No employer health tax for small firms. |
| Nova Scotia | Higher rates; ~$12,200 provincial tax on $100,000 income. |
| Ontario | Moderate rates with a health premium based on income. |
Frequently asked questions
How does moving provinces affect my taxes for the year?
Your province of residence on December 31st determines the provincial tax rate applied to your entire year's income. If you move from a higher-tax province to a lower-tax province like Alberta before the end of the year, you will pay the lower Alberta rates on all income earned that year. The main exception is Quebec, which has its own tax administration and requires separate filing. This rule makes the timing of a move a potentially important tax planning consideration.
Why is my take-home pay so different in Alberta versus Quebec?
Provincial income tax rates vary dramatically. Alberta has a low, flat tax structure with rates of 8% and 10%, and no provincial sales tax. Quebec has among the highest combined rates when you include its higher pension plan contributions and parental insurance premiums. On a $100,000 salary, you could have roughly $5,000 to $8,000 more in take-home pay in Alberta compared to Quebec. Quebec administers its own tax system, which adds complexity and generally higher deductions.
What is the basic personal amount and how does it work?
The basic personal amount is a non-refundable tax credit that makes a portion of your income tax-free. For the 2025 tax year, the federal basic personal amount is $16,129. This means you do not pay any federal income tax on the first $16,129 you earn. Each province also has its own basic personal amount, providing an additional amount of provincial tax-free income. This credit benefits all taxpayers equally, regardless of their total income level.
Should I only look at salary when comparing job offers?
No, you must consider the total compensation package. Benefits like employer pension contributions, group health and dental insurance, RRSP matching, and paid vacation can add significant value, often thousands of dollars per year. A $90,000 job with strong benefits can be worth more than a $100,000 job with none. Also, compare contract work carefully, as contractor rates typically need to be 25% to 40% higher than a salary to account for the lack of benefits and job security.
How do I account for cost of living in a salary comparison?
Use your calculated net pay from a salary calculator as a starting point, then research cost-of-living data for the specific city. Housing is the largest variable, with average rents in Toronto being nearly double those in Winnipeg. You must factor in costs for housing, food, transportation, and childcare. A higher net salary in an expensive city may leave you with less disposable income than a lower salary in a more affordable city, so both figures are essential for a true comparison.
What makes Quebec's tax system different?
Quebec administers its own provincial income tax through Revenu Quebec, meaning residents file two separate tax returns. It has the Quebec Pension Plan, which has a higher contribution rate than the CPP, and the Quebec Parental Insurance Plan. Combined with higher income tax rates, this leads to the highest overall payroll deduction rates in Canada. However, Quebec funds social programs like subsidized daycare and lower tuition, which may offset the higher tax burden for some residents.
Sources and further reading
- Salary Comparison Calculator Canada 2026 yourincomecalculator.com
- Annual Salary Calculator (2024 to 2026): Gross & After‑Tax wowa.ca
- Payroll Calculator calc.paymentevolution.com
This article explains how things work and is not financial, tax or legal advice. Rules, limits and rates change, so check the current figures with the Canada Revenue Agency, your province or your financial institution before you act.