The average house price in Toronto, as of recent 2026 data, is approximately $1,034,320 for the City of Toronto and around $1,006,409 for the broader Greater Toronto Area (GTA). These figures represent a complex market where average and median prices can move differently from the benchmark price, indicating shifts in the types of homes being sold. Understanding these prices is crucial for Canadians as housing affordability and market conditions directly impact major financial decisions like buying a first home, investing, or downsizing. The Toronto market is currently characterized by increased buyer choice and negotiating leverage compared to previous years, though prices remain significantly higher than historical norms.
Understanding Different Price Measures
When discussing Toronto's house prices, it is essential to distinguish between the average price, the median price, and the benchmark price. The average price is the sum of all sale prices divided by the number of sales, which can be skewed by a few very high or low value transactions. In September 2026, the average selling price for the Greater Toronto Area was $1,006,409. The median price, which is the middle point where half of homes sold for more and half for less, was $860,000 for the GTA in the same month. The benchmark price, represented by the MLS Home Price Index, aims to track the value of a typical home by accounting for consistent attributes like size and location, and it was $917,600 for the GTA in September 2026. These different metrics can tell conflicting stories in a single month, such as when the average price rises while the benchmark falls, indicating a change in the mix of properties sold rather than a broad market increase. For example, in September 2026 the City of Toronto's average price rose 5.6 percent from August to $1,034,320 while its benchmark price fell 1.1 percent to $908,200, a clear signal of a shifting sales composition.
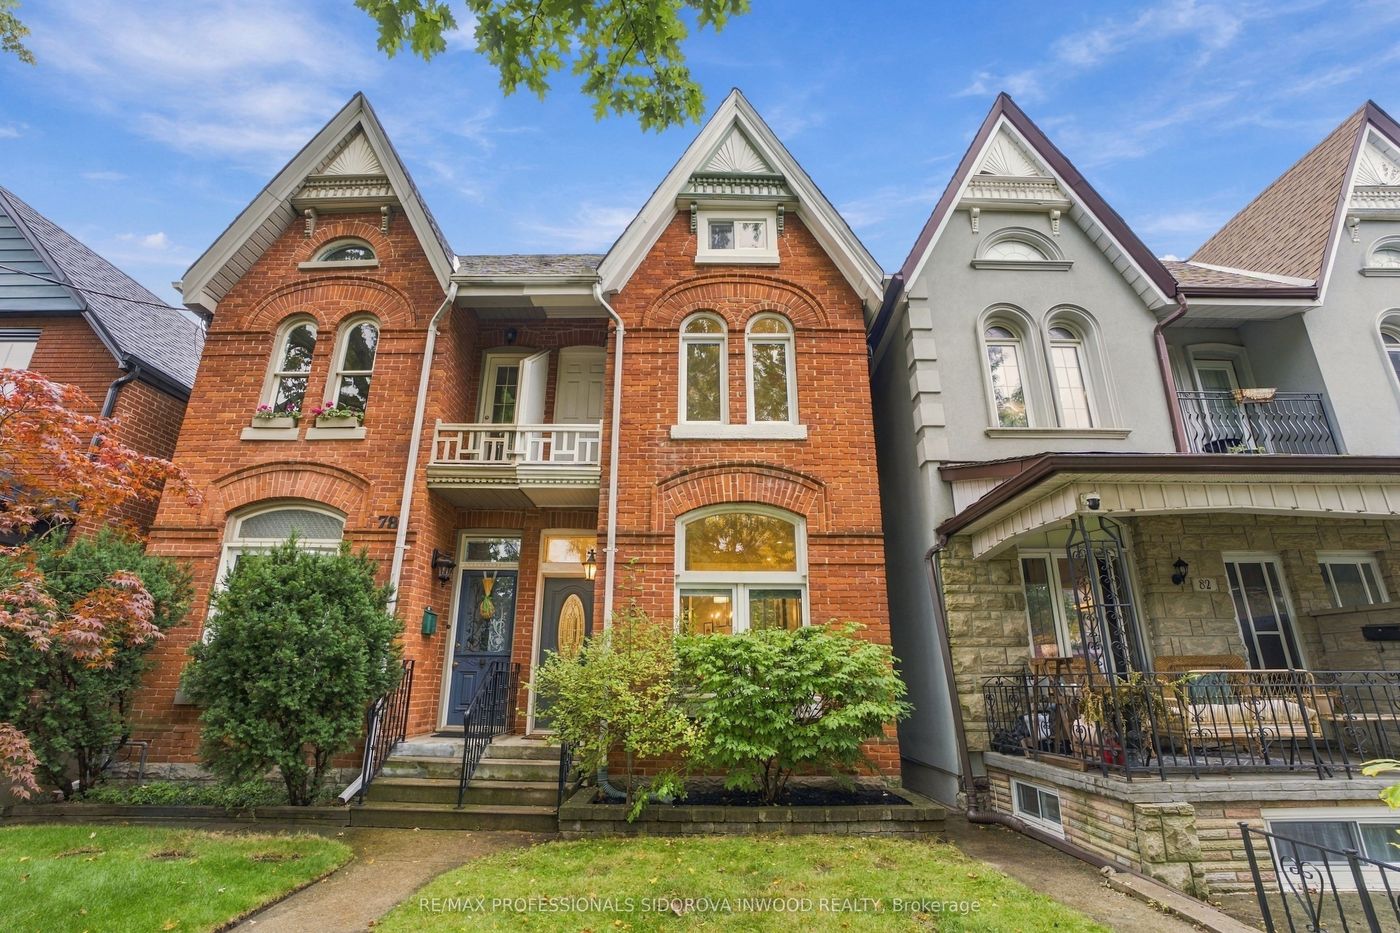
Detailed Market Conditions for Late 2026
The Toronto housing market in late 2026 is defined by a significant divergence between sales activity and new listing volume. For September 2026, Greater Toronto Area sales totalled 5,040, which was virtually unchanged from August and down 9.0 percent from September 2025. New listings, however, jumped to 16,500, a 36.6 percent increase from the previous month and a return of sellers after the summer lull. This surge in new listings without a matching rise in sales pushed the raw sales-to-new-listings ratio down to 30.5 percent from 41.9 percent in August. A ratio below 40 percent generally indicates a buyer's market, where buyers have more choice and negotiating power. The Toronto Regional Real Estate Board described homebuyers as being in a holding pattern due to ongoing uncertainty around the economy, employment, inflation and borrowing costs. Consequently, homes in the GTA sold for an average of 98 percent of their listing price, and the average property days on market held at 51. The months of supply, a calculation of active listings divided by sales, rose from 4.8 in August to 5.2 in September, moving further into buyer-leaning territory.
Price Performance by Specific Housing Type
Price movements vary significantly across different types of residential properties in Toronto, with detached homes and condominiums showing distinct trends. The most expensive segment remains single detached homes, with a median sale price of $1,100,000 in the third quarter of 2026, though this was down 6 percent from the same period a year earlier. Semi detached homes had a median price of $882,000 for Q3 2026, representing a 5.9 percent annual decline. More affordable options include townhouses and condominium apartments. The median price for a condominium townhouse was $655,000 in Q3 2026, down 7.1 percent from the previous year. Condominium apartment units had a median price of $530,000, reflecting a 7 percent annual decrease. These quarterly figures from the Canadian Real Estate Association show that the condominium market has experienced slightly larger annual price corrections. Monthly data from August 2026 provides further granularity, showing the average selling price for a single family home was $1,128,600, for a townhouse was $666,500, and for a condo was $531,200.
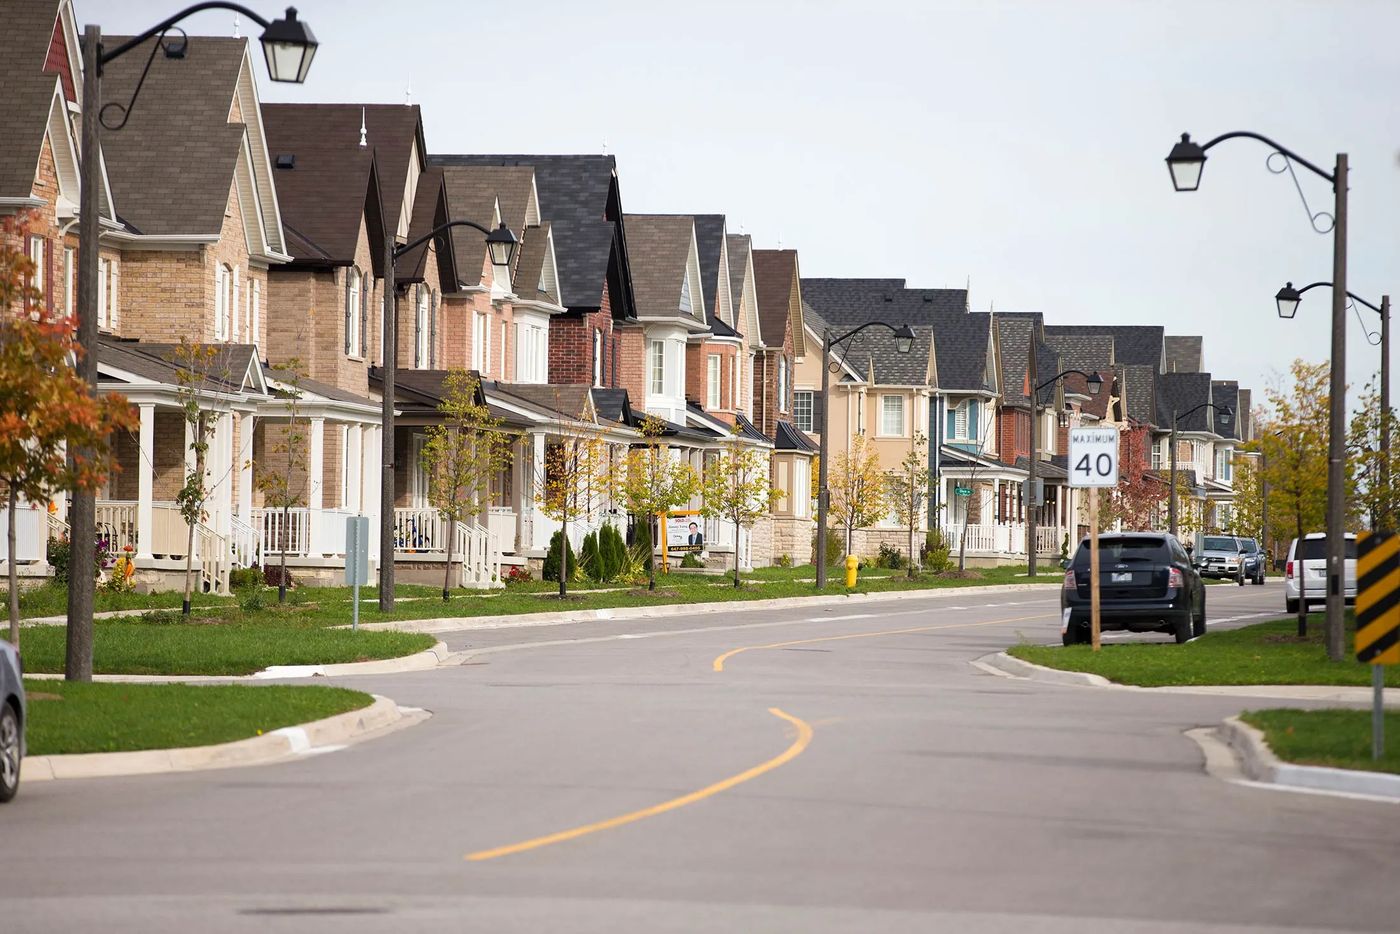
City of Toronto Versus Greater Toronto Area Dynamics
The housing market within the City of Toronto proper often behaves differently from the broader Greater Toronto Area, and comparing the two is important for accuracy. In September 2026, home sales in the City of Toronto reached 1,937, up 9.6 percent from August but about 6.1 percent below September 2025. New listings in the city surged to 6,521, a 55.3 percent increase month over month, while active listings increased 13.0 percent to 9,865. The raw sales-to-new-listings ratio for the city dropped sharply to 29.7 percent from 42.1 percent in August. The city's average price was $1,034,320, about 5.1 percent lower than September 2025, and its median price was $810,000, down roughly 4.7 percent year over year. Homes in the city sold for an average of 99 percent of the listing price, with 33 listing days and 45 property days on market. These figures show that while the city's inventory was lower than a year ago, the rapid return of sellers relative to buyers made its market more buyer-friendly in September 2026.
Key Market Indicators and Their Interpretation
Several key metrics are used by analysts to gauge the health and direction of the Toronto real estate market, and each has a specific meaning. The sales-to-new-listings ratio is a primary indicator of market balance. A ratio between 40 and 60 percent suggests balanced conditions, while below 40 percent indicates a buyer's market and above 60 percent a seller's market. In September 2026, the GTA's ratio was 30.5 percent, firmly in buyer market territory. Months of supply is another critical measure, calculated by dividing active listings by sales. Between three and five months of supply generally indicates balanced conditions. The GTA's months of supply rose to 5.2 in September 2026 from 4.8 in August, further confirming increased buyer leverage. The benchmark price from the MLS Home Price Index is also vital as it attempts to filter out market mix shifts and show pure price change for a typical home. Other important indicators include the percentage of list price achieved, which was 98 percent for the GTA in September, and the days on market figures, which help quantify the pace of sales.
- Sales-to-New-Listings Ratio: Below 40% = Buyer's Market. 40-60% = Balanced. Above 60% = Seller's Market.
- Months of Supply: 3-5 months generally indicates balanced market conditions.
- MLS HPI Benchmark Price: Tracks value of a typical home, adjusting for property attributes.
- Average Sale Price vs. List Price: Indicates negotiation leverage (e.g., 98% in Sept 2026 GTA).
- Days on Market: Measures marketing time (e.g., 51 property days in Sept 2026 GTA).
- Active Listings Count: Total inventory available for sale (26,131 in GTA for Sept 2026).
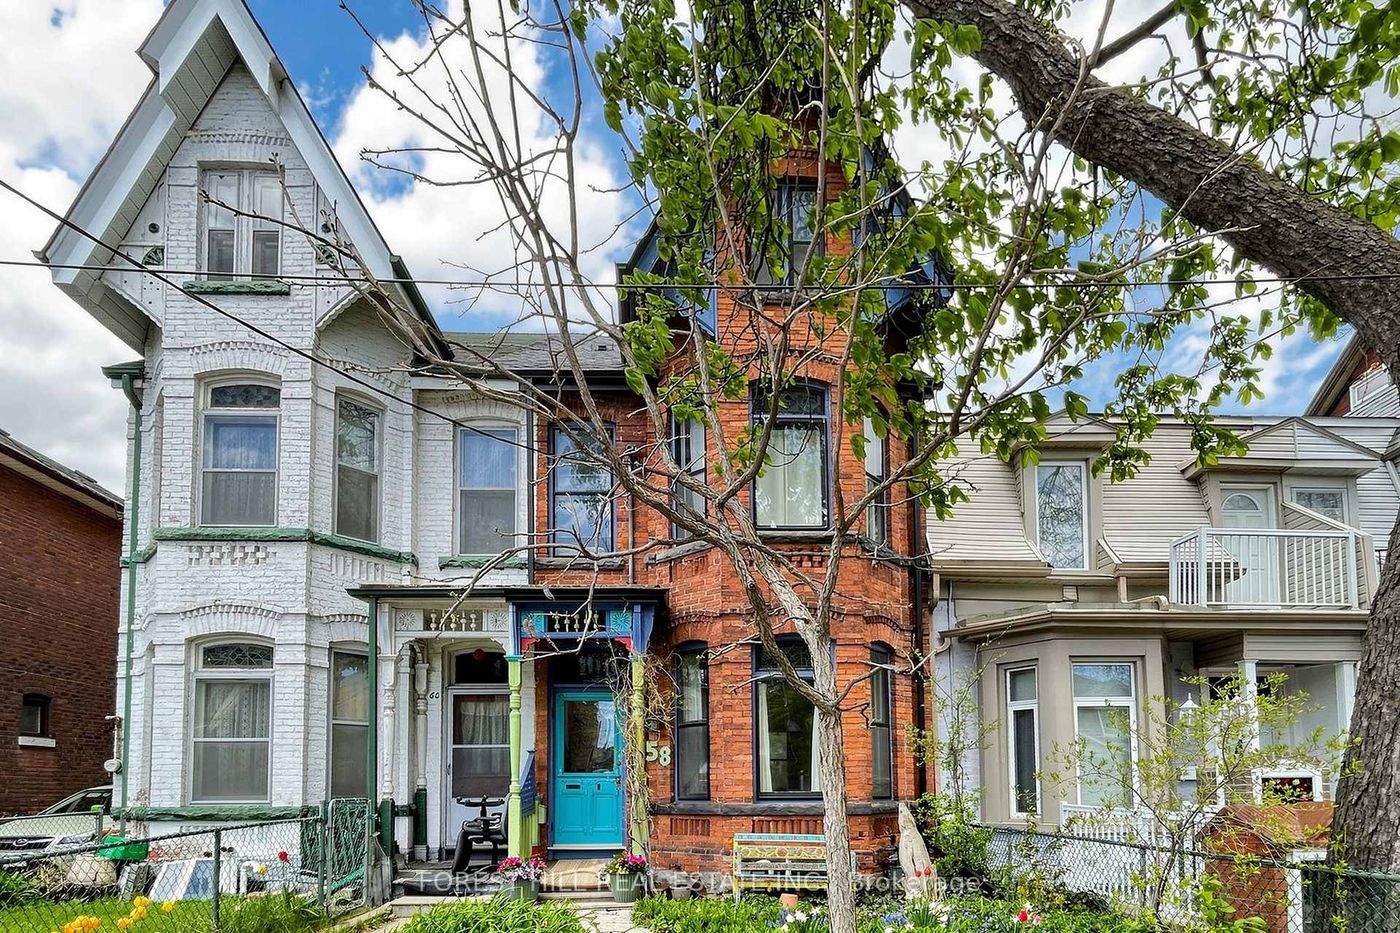
Historical Price Context and Long Term Trajectory
Toronto's housing market has undergone a dramatic transformation in affordability over the past two decades, with prices moving far beyond early 2000s levels. While current prices in 2026 are below the all time highs seen in 2022, they remain substantially higher than historical norms. For context, the average price in 2003 was $294,747 with 82,434 sales. The market experienced an unprecedented surge during the pandemic, with Ontario's housing market rising by 64 percent in the space of just two years. Government policies like the Fair Housing Plan and the mortgage stress test have also played documented roles in shaping price trajectories at various points. The Teranet National Bank Composite House Price Index, which tracks repeat sales, showed Toronto prices were down 8.1 percent year over year as of May 2026. The Canadian Real Estate Association expects the national average resale price to rise by 1.5 percent in 2026 to $688,955, reflecting a forecast of gradual stabilization. This long term perspective is important for understanding that current prices, while lower than the peak, are part of a much higher plateau established over the last twenty years.
The Toronto Rental Market Landscape
The rental market in Toronto operates in tandem with the ownership market and provides an alternative for many residents, with its own set of price trends. As of August 2026, the average rent in Toronto was $2,571, which represented a 1.80 percent decrease from the previous year. Breaking this down by unit type, the average rent for a one bedroom apartment was $2,221, down 3.01 percent year over year. The average rent for a two bedroom apartment was $2,939, which saw a modest increase of 0.65 percent compared to August 2025. Toronto's average rent ranked fourth highest among major Canadian cities in this period, behind North Vancouver, Vancouver, and Oakville. The softening in rental prices aligns with the broader trend of increased supply and cautious demand seen in the sales market, as economic uncertainty affects both tenants and prospective buyers. This rental data provides a complete picture of housing costs for those not entering the ownership market.
Comparative National and Regional Market Data
Toronto's market does not exist in isolation, and comparing it to other Canadian regions provides valuable context for its price levels and trends. According to the Teranet National Bank Composite House Price Index for May 2026, year on year price declines were observed in seven of eleven major cities, with Hamilton down 9.0 percent and Toronto down 8.1 percent. Other cities with annual declines included Vancouver at 5.7 percent, Calgary at 1.7 percent, Ottawa Gatineau at 1.7 percent, Victoria at 0.8 percent, and Halifax at 0.5 percent. Conversely, year on year price growth was recorded in Quebec City at 10.4 percent, Winnipeg at 5.9 percent, Montreal at 2.9 percent, and Edmonton at 2.9 percent. The Canadian Real Estate Association's national composite MLS HPI was down 4.1 percent year over year in May 2026, while the non seasonally adjusted average price of homes sold nationally increased by 1.5 percent to $702,079. This shows that Toronto's price corrections are part of a broader national pattern, though more pronounced than in some affordable markets.
| City | Year-Over-Year Price Change (May 2026) |
|---|---|
| Hamilton | -9.0% |
| Toronto | -8.1% |
| Vancouver | -5.7% |
| Quebec City | +10.4% |
| Winnipeg | +5.9% |
| Montreal | +2.9% |
| Edmonton | +2.9% |
Common Analytical Mistakes and Data Pitfalls
There are several common pitfalls for individuals trying to understand Toronto's real estate data, and avoiding them leads to a more accurate market view. One major mistake is relying solely on the average price without considering the median or benchmark price, as the average can be heavily influenced by a small number of luxury sales. Another error is misinterpreting monthly price fluctuations without considering seasonal patterns, such as the typical increase in new listings every fall which occurred in September 2026. People often overlook the difference between the City of Toronto proper and the broader Greater Toronto Area, which includes many surrounding municipalities with different price points and market dynamics. Failing to account for the sales to new listings ratio and months of supply can lead to a misunderstanding of whether the market favours buyers or sellers. Finally, comparing current prices only to the immediate past peak instead of longer term historical trends can provide a distorted view of affordability and market cycles. Analysts also caution that graphs of price trends do not explain the underlying factors driving changes, such as specific government policy announcements.
Frequently asked questions
How does Toronto's housing market compare to other Canadian cities?
Toronto remains one of Canada's most expensive housing markets, though it has seen significant price corrections. As of May 2026, its year over year price decline of 8.1 percent was larger than Vancouver's 5.7 percent decline. In contrast, more affordable markets like Quebec City, Winnipeg, and Edmonton showed price growth. Toronto's average rent of $2,571 in August 2026 was the fourth highest in the country.
What is the average house price in Toronto right now?
As of September 2026, the average selling price for a home in the City of Toronto was $1,034,320. For the broader Greater Toronto Area, the headline average price was $1,006,409. These figures represent a monthly increase but remain lower than the previous year's levels. It is important to note that the average price is calculated from the total dollar value of all homes sold divided by the number of sales. This measure can be influenced by the mix of properties sold, meaning a higher proportion of luxury home sales can lift the average even if typical home values are not rising.
Is Toronto a buyer's or seller's market in 2026?
In September 2026, the Toronto housing market moved into buyer leaning territory. The key indicator is the sales to new listings ratio, which fell to 30.5 percent for the GTA, below the 40 percent threshold that indicates a buyer's market. Furthermore, the months of supply rose to 5.2, which is above the three to five month range that signifies balanced conditions. This increase in supply relative to demand gave buyers more choice and negotiating leverage. Homes sold for an average of 98 percent of the listing price during this period, further confirming buyer advantage.
How much have Toronto house prices dropped from the peak?
Recent analysis indicates that current home prices in Toronto are roughly 15 to 20 percent lower than the all time high price. Specific data from September 2026 shows the average price in the GTA was down 5.1 percent compared to September 2025. Other metrics confirm this downward trend from peak levels, as the Teranet National Bank Composite House Price Index showed Toronto prices were down 8.1 percent year over year as of May 2026. This correction has been part of a broader market adjustment following the post pandemic surge in prices.
What is the difference between average price and benchmark price?
The average price is the total dollar value of all homes sold divided by the number of sales. This figure can be significantly skewed by changes in the mix of properties sold, such as a higher volume of luxury homes in a given month. In contrast, the benchmark price, specifically the MLS Home Price Index, estimates the value of a typical home by tracking properties with consistent attributes over time. This method aims to filter out mix changes to show pure price movement. For example, in September 2026, the GTA average price was $1,006,409 while the benchmark price was $917,600, highlighting the impact of sales mix.
What is the median house price in Toronto?
The median sale price is the midpoint where half of homes sold for more and half for less. For the Greater Toronto Area in September 2026, the median price was $860,000. This provides a different perspective than the average, as it is less affected by extremely high or low value sales. For specific housing types in the third quarter of 2026, the median prices were $1,100,000 for a single detached home, $882,000 for a semi detached home, $655,000 for a condominium townhouse, and $530,000 for a condominium apartment. These figures show the price distribution across different segments of the Toronto market.
Sources and further reading
- Toronto Housing Market: Oct. 6th, 2026 Update wowa.ca
- Toronto Housing Market | 2026 Home Prices nesto.ca
- Toronto Median Price | CREA Statistics creastats.crea.ca
- Toronto Real Estate Prices Housing Report (1967 to 2026) precondo.ca
- Canada's Residential Property Market Analysis 2026 globalpropertyguide.com
This article explains how things work and is not financial, tax or legal advice. Rules, limits and rates change, so check the current figures with the Canada Revenue Agency, your province or your financial institution before you act.