The Ontario housing market in late 2026 is characterized by declining prices and sales activity amid persistent affordability challenges. The average home price in the province decreased by 4.3% year-over-year to $791,691 as of October 2026. This cooling trend is widespread, with the Greater Toronto Area seeing a 5.1% annual price decline and sales volumes tracking below historical averages. Understanding these market dynamics is crucial for buyers, sellers, and policymakers in one of Canada's largest and most influential real estate environments.
Current Provincial Market Conditions
The Ontario housing market in 2026 is in a corrective phase following years of rapid price growth. The average home price stood at $791,691 in October 2026, representing a 4.3% decrease compared to the same period in 2025. Sales activity has also softened, with 13,340 units sold in September 2026, which was 8.3% lower than September 2025 and 0.8% below the five-year average. This decline in both price and volume signals a shift in market momentum. The Canadian Real Estate Association notes that softer sales volume is now evident in 81% of regions analyzed across the country, with many moving into buyer-favourable conditions. This broad cooling reflects the impact of sustained high borrowing costs and economic uncertainty, which have significantly weighed on buyer confidence in Ontario specifically.
The monthly change in housing investment for Ontario was a 9.4% increase to $5.1 billion as of August 2026. This figure represents a monthly fluctuation within a broader annual downtrend. The market's failure to respond positively to multiple Bank of Canada interest rate cuts between June 2024 and October 2025 distinguishes it from many other provinces. Unaffordability remains the central issue, acting as a persistent drag on demand. The current conditions provide a stark contrast to the peak activity seen in previous years, setting the stage for a prolonged period of market rebalancing.
Greater Toronto Area and Regional Breakdown
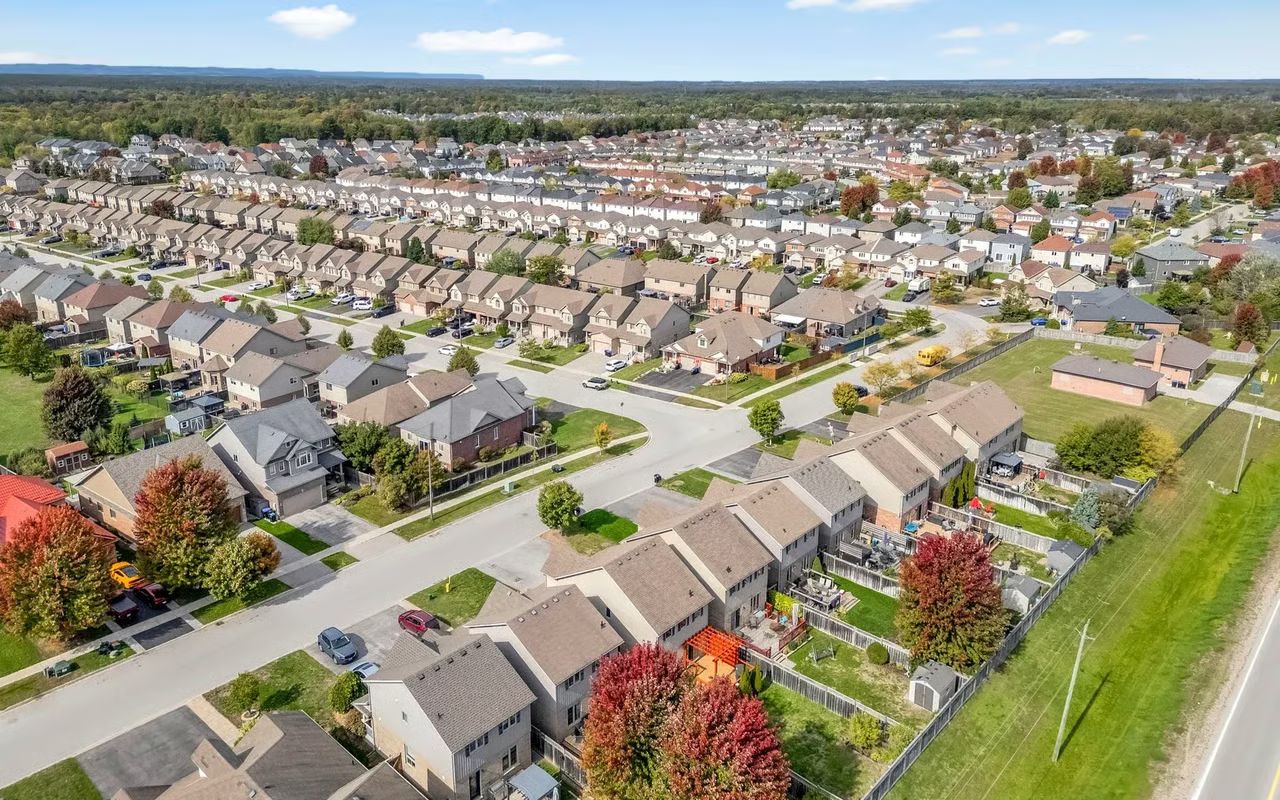
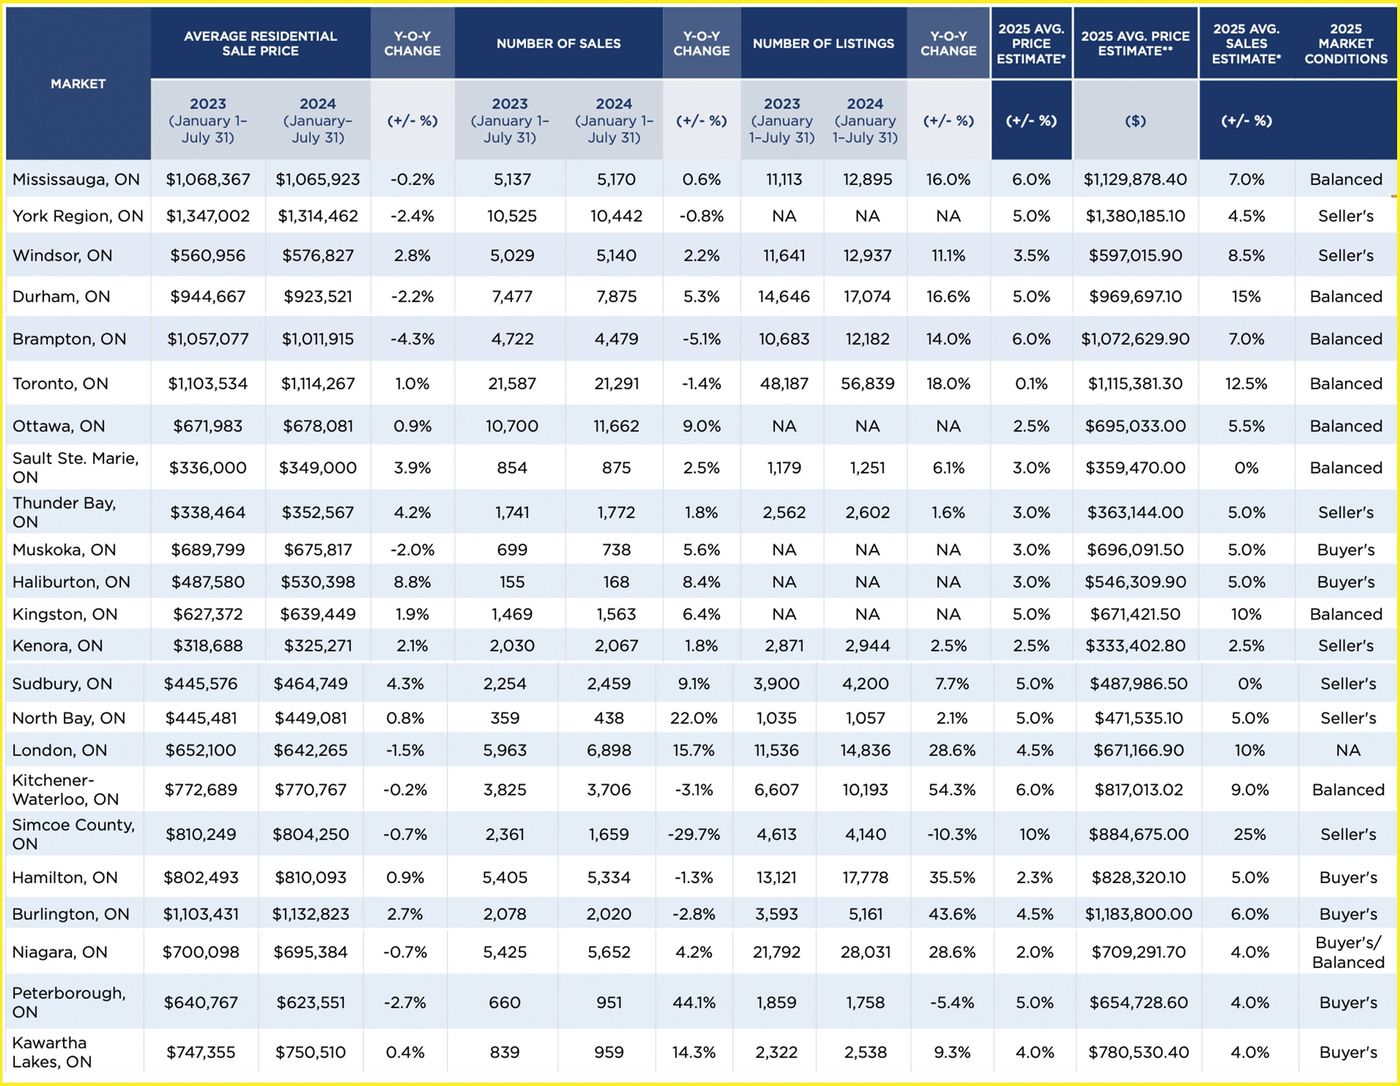
The Greater Toronto Area market, a primary driver of provincial trends, mirrors the broader slowdown. The average home price in the GTA decreased by 5.1% year-over-year. Within the City of Toronto, the average house price was reported at $1,092,042 with 5,894 new listings in a recent 28-day period. Surrounding municipalities show varied but generally negative annual price movements. Markham's average price was $1,125,353, down 4.4% year-over-year, while Vaughan's average price was $1,163,441, showing minimal change. The Kitchener-Waterloo-Cambridge region recorded an average price of $703,800, reflecting a 6.6% annual decline and a 2.6% monthly decrease. Ottawa's market, supported by a robust public sector job market, also experienced price declines. These regional figures illustrate that the market adjustment is not confined to the provincial core but is widespread across Ontario's major urban centres.
Other significant regional markets include Hamilton and London, which have seen significant growth in past years driven by sectors like technology attracting young professionals. Their home price growth has since slowed in line with the provincial trend. The performance of these markets is closely monitored through tools like the MLS Home Price Index, which was launched in January 2012 and developed by Altus Group for founding real estate boards including Toronto. This index is a key tool for determining price trends beyond simple average figures. The data for these regions is compiled monthly by CREA from the Multiple Listing Service reports provided by local real estate boards.
Key Factors Influencing the 2026 Market
Several interconnected factors are shaping the Ontario housing landscape in 2026. High borrowing costs remain a primary headwind, despite multiple interest rate cuts from the Bank of Canada between June 2024 and October 2025. Ontario's market has failed to respond positively to these cuts, unlike many other provinces, highlighting deep-seated affordability issues. Economic uncertainty, particularly related to international tariff concerns, is further dampening buyer confidence. On the supply side, overall housing starts are projected to fall to near two-decade lows in 2026, driven by very low condominium pre-construction sales. A modest rebound is anticipated but will be insufficient to quickly address the underlying supply gap. The combination of weak demand due to affordability constraints and constrained new supply creates a complex market environment with little immediate impetus for a price recovery.
The national context also plays a role, as Canada still needs to build between 187,000 and 238,000 homes each year to close its housing supply gap. As construction falls short of meeting this demand, the long-term implications for affordability are significant. In Ontario, the 2021 Census reported that 24.2% of households were in core housing need, an indicator within the Quality of Life Framework for Canada. These structural challenges mean that even as prices correct from peak levels, the fundamental issue of housing accessibility for many residents remains unresolved. The market is being influenced by both cyclical economic pressures and these longer-term demographic and supply constraints.

Sales Activity and Inventory Trends
Sales activity across Ontario and Canada is tracking a decline of about 5% for the full year 2026 and is unlikely to recover this lost ground in 2027, according to forecasts. The provincial sales figure of 13,340 units in September 2026 was also 21% below the ten-year average for that month, indicating a significant and sustained pullback in transaction volume. This decline in sales has contributed to a shift in market balance. The current conditions are described as buyer-favourable or balanced in the majority of regions, a notable change from the seller's market conditions that dominated previous years. This shift provides prospective buyers with more selection and less pressure during negotiations, though it also reflects broader economic caution.
The public release of this data follows a regular schedule designed to inform various stakeholders. Each month at midpoint, CREA provides its members and the general public with resale data from the previous months. After each quarter, CREA revises its forecast for provincial and national sales activity and average home prices. These revisions take into account new housing market data, as well as changes in the outlook for interest rates and the macroeconomy. The data serves multiple purposes: it gives the public a snapshot of the market, helps REALTORS advise their clients knowledgeably, and assists politicians and government policymakers in crafting effective legislation and regulations.
Data Sources and Reporting Frameworks
Reliable market analysis depends on robust data collection from several official sources. Statistics Canada produces a variety of interactive visualization tools and runs programs like the Canadian Housing Statistics Program, which provides comprehensive information on residential properties and their owners. The Canadian Housing Survey, conducted by Statistics Canada and the CMHC, offers insights into housing needs, conditions and experiences from a sample of Canadian households. The Census Program Data Viewer allows for comparison of housing indicators between the 2016 and 2021 Censuses. These federal sources provide the granular, long-term data needed to understand market fundamentals beyond monthly price fluctuations.
- The Canadian Real Estate Association compiles monthly MLS sales statistics.
- Statistics Canada manages the Canadian Housing Statistics Program.
- The Canada Mortgage and Housing Corporation co-conducts the Canadian Housing Survey.
- The MLS Home Price Index was launched in January 2012.
- CREA provides monthly data updates at mid-month.
- Quarterly forecast revisions incorporate new economic data.
Private sector analysis also contributes to the market outlook. Reports from TD Economics and RBC Economics provide economic forecasts and interpret the data, though they carry disclaimers that their views may change based on market conditions and are not guaranteed to be accurate or complete. These analyses often focus on future economic and financial market performance based on certain assumptions, and they acknowledge inherent risks and uncertainties in their projections. Together, public and private data sources create a comprehensive picture for those involved in the Ontario housing market.
Outlook and Forecast for Ontario
The outlook for Ontario's housing market remains cautious. RBC Economics anticipated prices would decline in the latter half of 2025 and into 2026, with Ontario and British Columbia experiencing the steepest drops due to high unaffordability. This projection has materialized in the reported year-over-year price decreases. The national forecast update suggests the market cooling is characterized by softer sales volume and a pricing correction. For Ontario specifically, the path to a sustained recovery is constrained by the need for significant improvements in affordability and consumer confidence. A modest rebound in housing starts is projected but will not rapidly alter the supply-demand equation. The market is expected to remain in a period of adjustment as it seeks a new equilibrium between prices, incomes, and borrowing costs.
The broader economic goals tied to housing also inform the long-term outlook. Sustainable Development Goal 11 aims to make cities and human settlements inclusive, safe, resilient and sustainable. Core housing need is an indicator in the Quality of Life Framework for Canada. The performance of the housing market has direct implications for these societal objectives. With housing starts projected at near two-decade lows and a national supply gap persisting, the challenges facing Ontario's market are likely to extend beyond the current cyclical downturn. The data and analysis provided by various organizations will continue to be essential for tracking progress and informing policy responses to these complex issues.
Common Market Metrics and Their Interpretation
Understanding the Ontario housing market requires familiarity with the key metrics reported by various agencies. The average home price, while a headline figure, is just one measure. The MLS Home Price Index provides a more stable view of price trends by tracking a typical home's attributes over time. Sales volume and the sales-to-new-listings ratio indicate market balance and momentum. The rental market survey reports vacancy rates and average rents, which influence first-time homebuyer decisions. Housing starts measure new construction activity, a critical component of future supply. Each metric offers a different perspective on the health and direction of the market.
- Average Home Price: Reported monthly by CREA, subject to compositional shifts.
- MLS Home Price Index: Measures price trends for a typical property.
- Sales Volume: Number of units sold, indicating market activity.
- Vacancy Rate: Percentage of rental units available, from CMHC survey.
- Housing Starts: Number of new construction projects begun.
- Core Housing Need: Indicator from Census on affordability and suitability.
These metrics are used by different groups for specific purposes. REALTORS use them to advise clients on pricing and timing. Policymakers use them to assess the effectiveness of housing programs and regulations. Economists use them to forecast future trends and assess risks to the financial system, such as those related to mortgage arrears and funding flows. For the public, these metrics provide a snapshot of market conditions, helping them make informed decisions about buying, selling, or renting. The consistent and transparent reporting of this data is a fundamental part of an informed housing market.
Frequently asked questions
What is the average house price in Ontario in 2026?
As of an October 15th, 2026 update, the average home price in Ontario is $791,691. This price represents a decrease of 4.3 percent year over year. The provincial market is characterized by softer sales volume and a shift toward buyer favourable conditions. High borrowing costs and economic uncertainty are contributing factors to the market cooling.
Is the Toronto housing market going down?
Yes, the Toronto housing market is experiencing a decline. Current Toronto MLS stats indicate an average house price of $1,092,042. The broader Greater Toronto Area's average home price decreased by 5.1 percent year over year. Home sales in Ontario were 0.8 percent below the five year average and 21 percent below the ten year average in September 2026.
What is the forecast for the Canadian housing market in 2026?
The forecast for the Canadian housing market in 2026 is for a cooling trend. National home sales are tracking a decline of about 5% for the year. Prices are declining in the latter half of 2025 and into 2026, with Ontario and British Columbia expected to see the steepest drops. A recovery in sales is not anticipated for 2027.
How many homes were sold in Ontario in September 2026?
In September 2026, home sales in Ontario numbered 13,340 units. This figure was a decrease of 8.3 percent from September 2025. The sales volume was 0.8 percent below the five year average. It was also 21 percent below the ten year average for that month.
What is the rental market like in Ontario?
The annual Rental Market Survey provides results for Canada, provinces, and major centres. This survey includes data on vacancy rates, average rent, and turnover rates. The Canada Mortgage and Housing Corporation conducts this research to offer insights into rental market conditions. The data helps inform understanding of the rental sector in Ontario.
Why are Ontario home prices falling?
Ontario home prices are falling primarily due to high borrowing costs and economic uncertainty. Despite multiple interest rate cuts from the Bank of Canada between June 2024 and October 2025, Ontario's market has failed to respond positively unlike many other provinces. Unaffordability and economic uncertainty, particularly related to tariff concerns, appear to weigh heavily on buyer confidence in Ontario's markets. This is reflected in the provincial data, such as the year over year decrease in the average home price to $791,691 as of October 2026. The broader Canadian housing market is cooling, with softer sales volume in 81% of regions analyzed and a shift toward buyer favourable conditions.
Sources and further reading
- Ontario Housing Market: Oct. 15th, 2026 Update wowa.ca
- Canada Housing Research, Data and Insights cmhc-schl.gc.ca
- Canadian Housing Market Stats, CREA crea.ca
- Housing statistics statcan.gc.ca
- Provincial Resale Market Outlook: High Borrowing Costs Set ... economics.td.com
This article explains how things work and is not financial, tax or legal advice. Rules, limits and rates change, so check the current figures with the Canada Revenue Agency, your province or your financial institution before you act.